
Cladogram Maker
Build clear, publication-ready cladograms showing evolutionary relationships and shared derived characters for biology courses and research papers.
Figure prompt
Describe the figure you want to create
Subject / Details (e.g., a process flow, key labels, visual style)
Not sure where to start? Use Example.
Start with 100 free credits|No credit card required
Get up to 300 free credits on day one when you join through an invite.
Reviewed by SciFig TeamUpdated
Cladogram Maker— templates & examples
Everything you need to build your cladogram
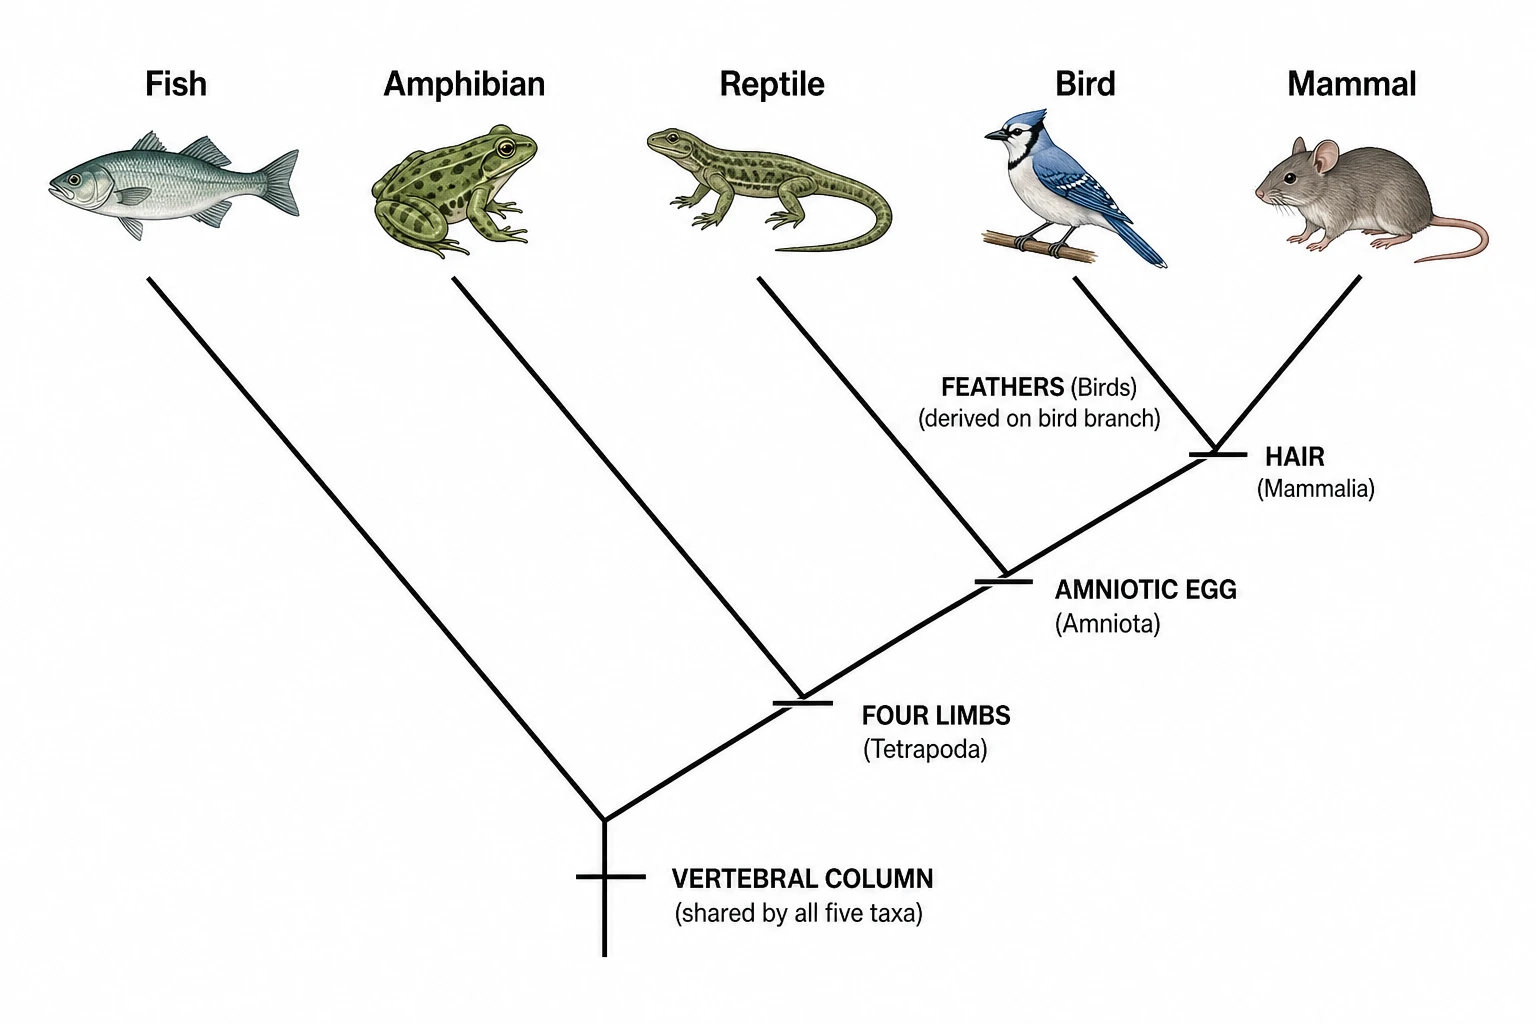
Build a cladogram from taxa and characters
Describe your organisms and their shared derived characters in plain language, and SciFig's cladogram maker lays out the branching diagram automatically. Nodes are labeled with synapomorphies and taxa appear at the tips — the structure any biology instructor or journal expects to see in a cladogram.
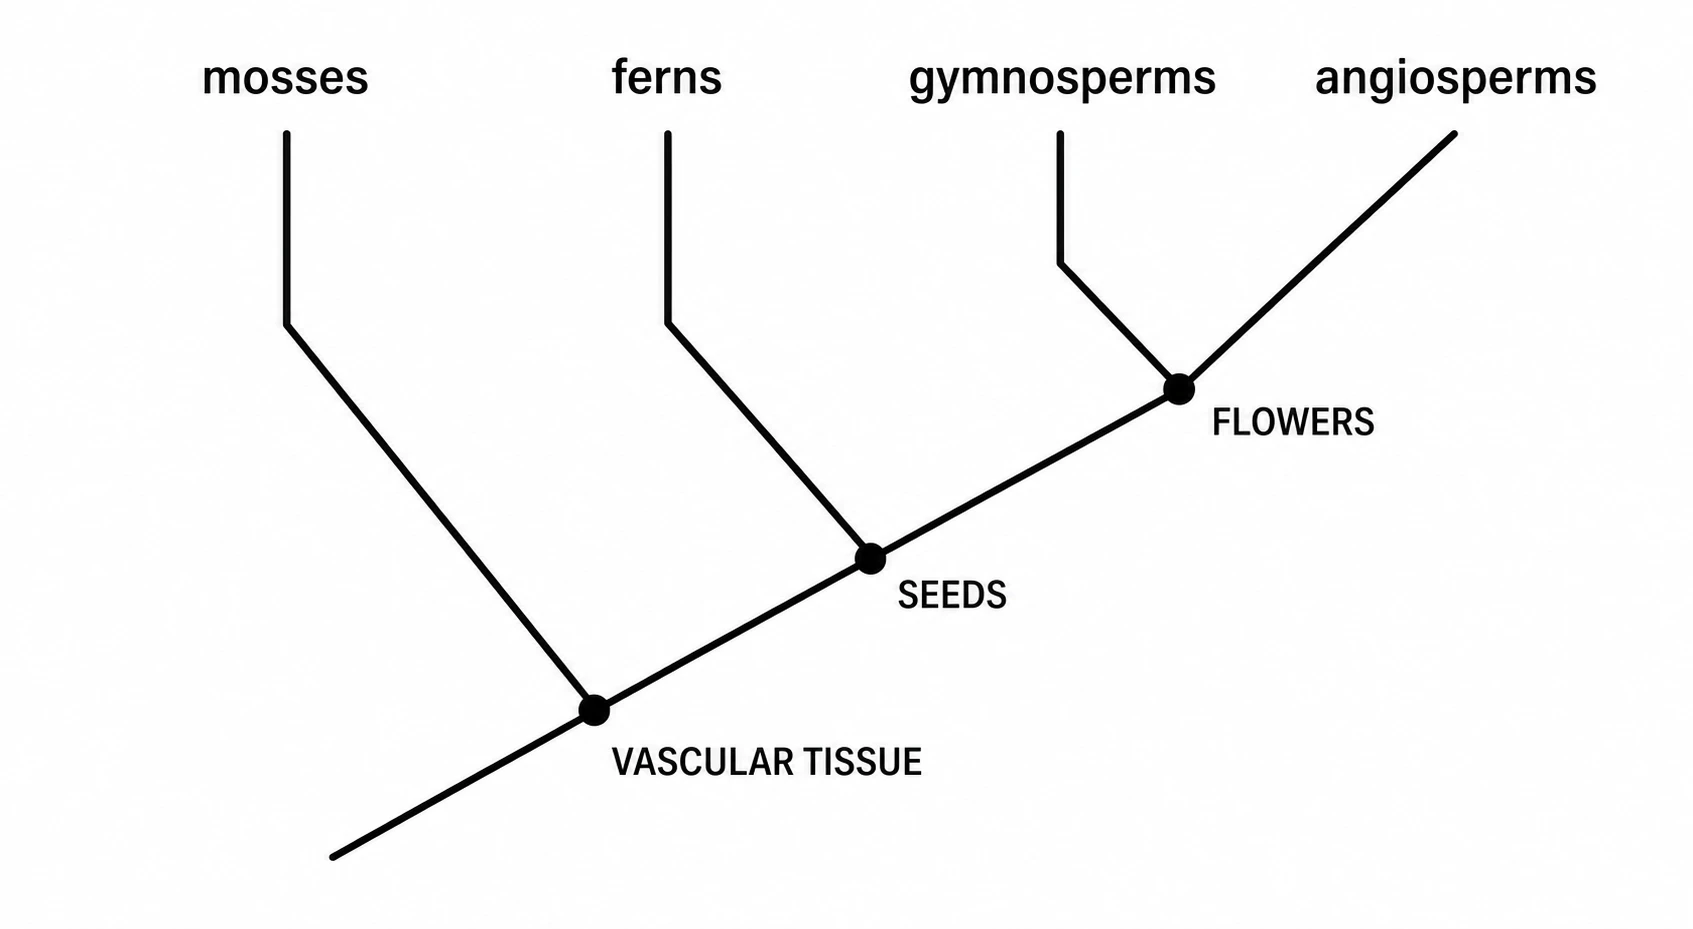
Start from a cladogram template
Skip the blank page by generating a reusable cladogram template with empty tip and node labels, then fill in your own taxa and traits. SciFig also provides filled examples for vertebrate evolution, plant phylogeny, and insect classification so you can see how to make a cladogram before adapting it to your own dataset.
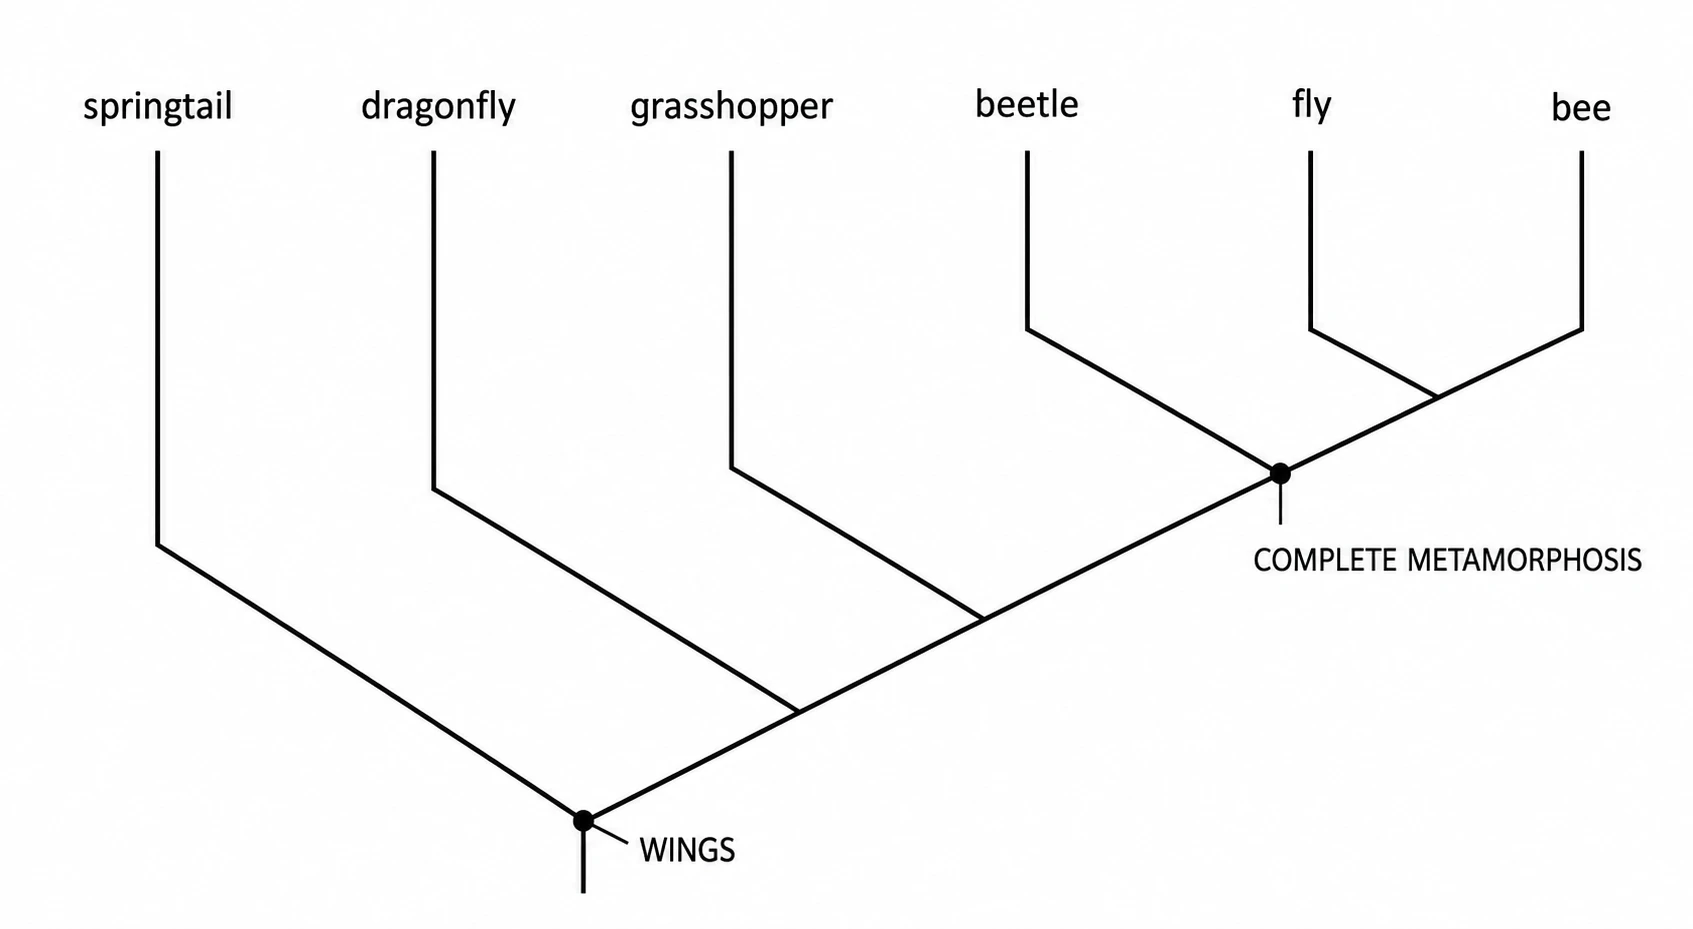
Export a publication-ready cladogram
Relabel branches, reorder taxa, and resize the cladogram for any paper or poster format. Every cladogram you generate stays fully editable so you can update the branching pattern as your analysis evolves. Export a clean, publication-ready figure directly from the cladogram maker in the format your instructor or journal requires.
What is a cladogram?
A cladogram is a branching diagram showing evolutionary relationships among organisms based on shared derived characters. Each branch point, or node, represents a common ancestor, and the pattern reveals which taxa are most closely related. Cladograms are central to phylogenetics and biological classification. With SciFig's cladogram maker you describe your taxa and traits in plain language and generate a clean, labeled cladogram you can edit and export for coursework or publication.
Why you need a cladogram
- Reveals evolutionary relationships among taxa at a glance
- Required for most comparative biology, taxonomy, and phylogenetics assignments
- Shows which shared derived characters unite each group at a node
- Provides a testable hypothesis about evolutionary history
- Helps readers compare competing branching arrangements quickly
- Accepted format for journals in zoology, botany, and paleontology
Key components of a cladogram
- Root — the common ancestor of all taxa in the diagram
- Nodes — branching points representing hypothetical common ancestors
- Branches — lines connecting ancestors to descendant taxa or nodes
- Taxa — the organisms or groups at the tips of the cladogram
- Synapomorphies — shared derived characters labeled at each node
- Outgroup — a taxon outside the study group used to root the tree
Where cladograms are used
- Comparative biology and systematics research papers
- High school and university biology assignments and exams
- Taxonomy and species classification studies
- Paleontology and fossil record interpretation
- Ecology and biogeography analyses
- Genetics and molecular phylogenetics publications
How to make a cladogram
Describe your cladogram
Tell SciFig what to draw in plain language — no design tools required.
Generate with SciFig
Get a clean, publication-ready figure that matches your description in seconds.
Edit & export
Vectorize it into editable SVG, relabel everything, and export for your paper, poster, or slides.
Cladogram Maker — Frequently Asked Questions
Common questions about Cladogram Maker.
More tools

Circuit Diagram Maker
Generate accurate circuit diagrams with labeled schematic symbols for research papers, lab reports, and technical publications.

Free Body Diagram Generator
Create accurate, publication-ready free body diagrams with labeled force vectors for weight, normal force, friction, and tension in seconds.

Graphical Abstract Maker
Generate a publication-ready graphical abstract — a single-panel visual summary that captures your study's methods, key finding, and result with clear icons and flow arrows.
Home
Free AI Scientific Figure Generator and Figure Maker — Create Research Figures, Images, Illustrations and Diagrams
Text-to-Figure
Generate a figure from a plain-language description
Models
Default to GPT Image 2 for journal papers; switch to Nano Banana Pro for slides and posters; pick Nano Banana 2 for routine figure work
Tutorials
Seven short walkthroughs of the AI scientific figure generator
Blog
Tutorials, tool comparisons, and publication tips for researchers.
Inspiration
Explore publication-ready scientific figure examples, copy the prompts, and use them as starting points for your own work.

Ready to publish?
Make your own cladogram in minutes.
Start for freeFree to start · No credit card required · Built for researchers