
Science Diagram Maker for Every Discipline
One science diagram maker for every field. Describe a mechanism, a circuit, a study flow or a reaction scheme, and get a labeled diagram you can edit down to the last text object.
Figure prompt
Describe the figure you want to create
Subject / Details (e.g., a process flow, key labels, visual style)
Not sure where to start? Use Example.
Start with 100 free credits|No credit card required
Get up to 300 free credits on day one when you join through an invite.
Reviewed by SciFig TeamUpdated
Science Diagram Maker for Every Discipline— templates & examples
Everything you need from a science diagram maker
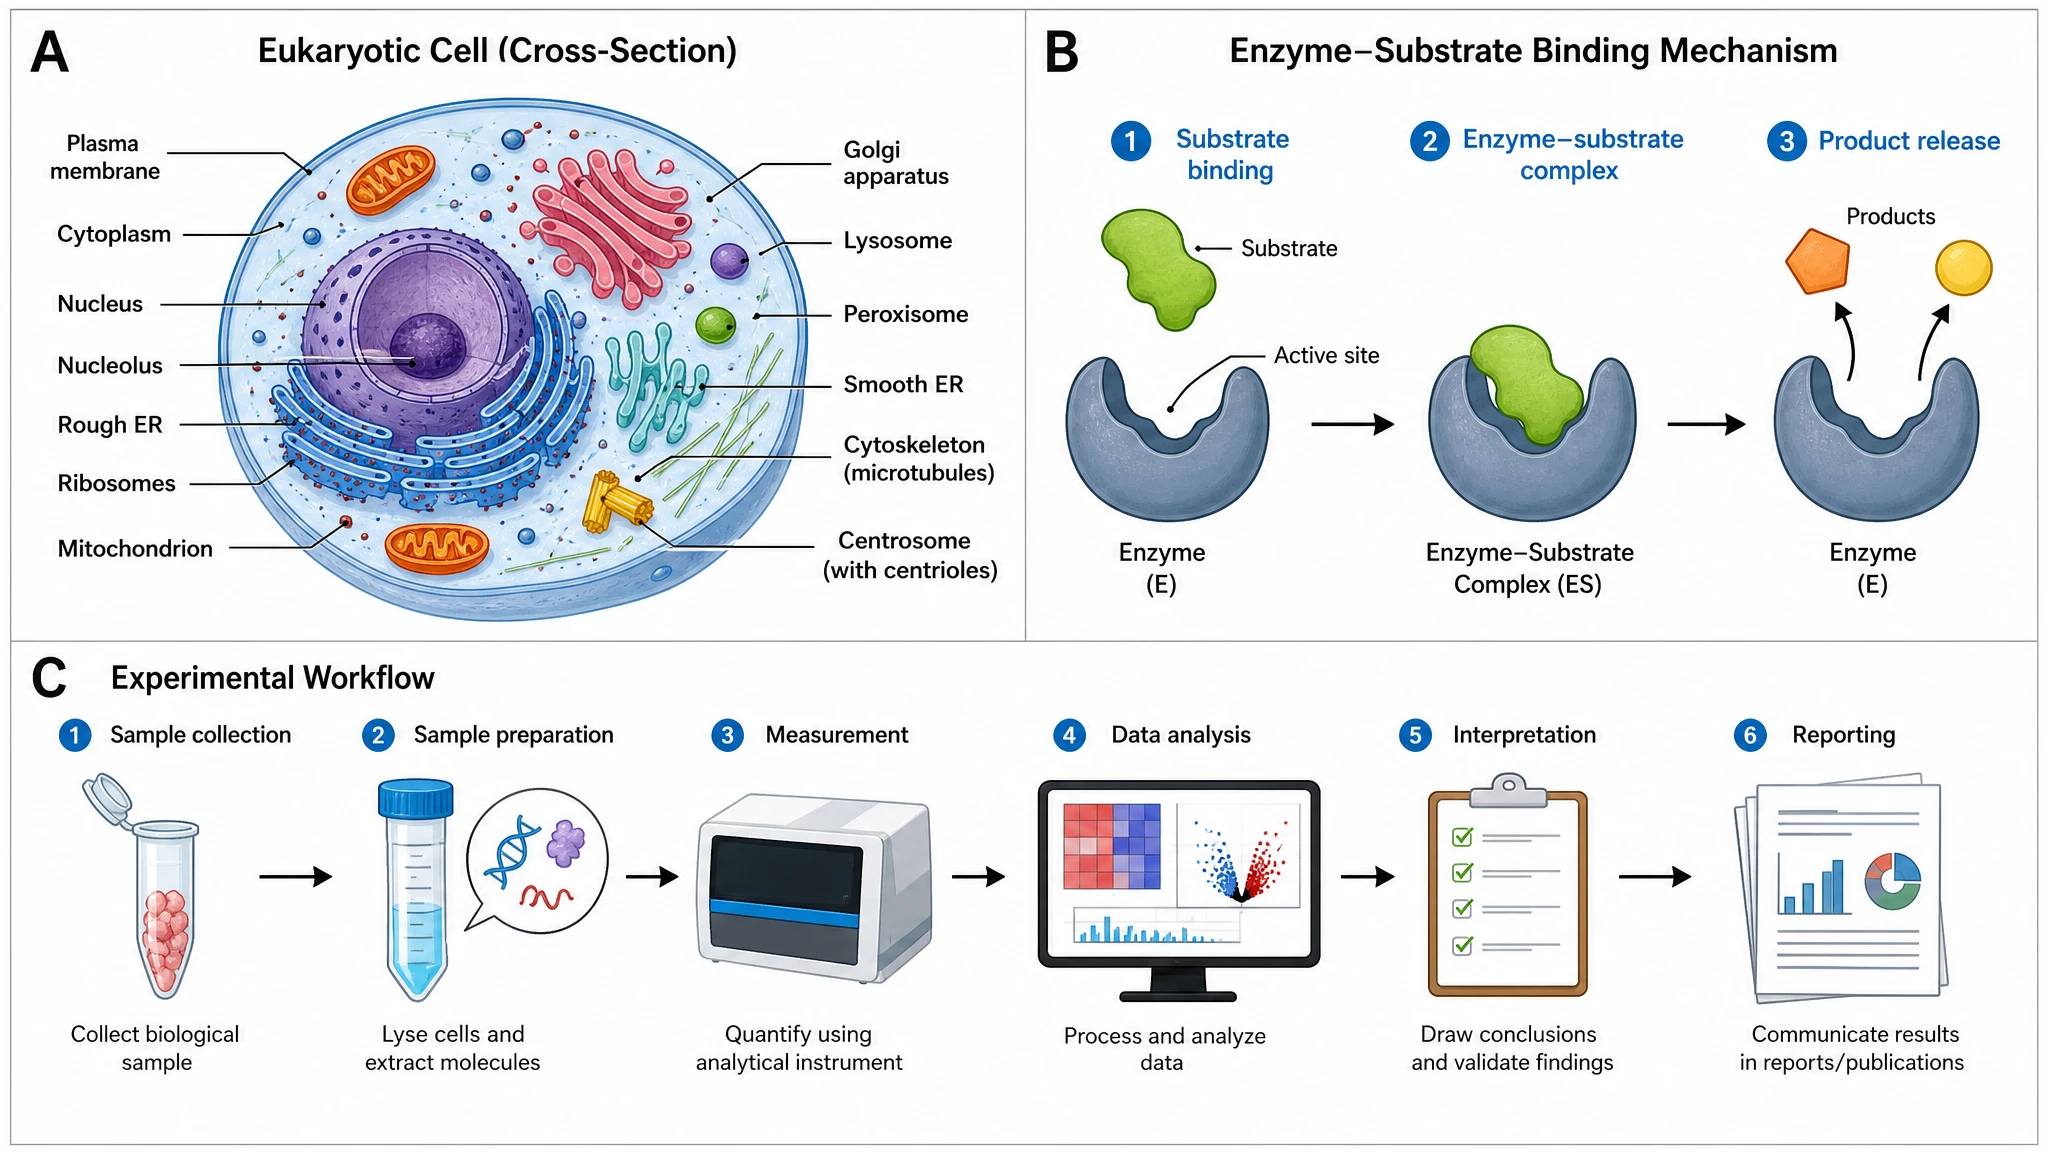
From a plain description to a science diagram
Describe the mechanism, circuit, or workflow in your own words. This science diagram maker lays out the elements, labels them with the terminology your field actually uses, and gives you a first version in seconds instead of an afternoon in Illustrator.
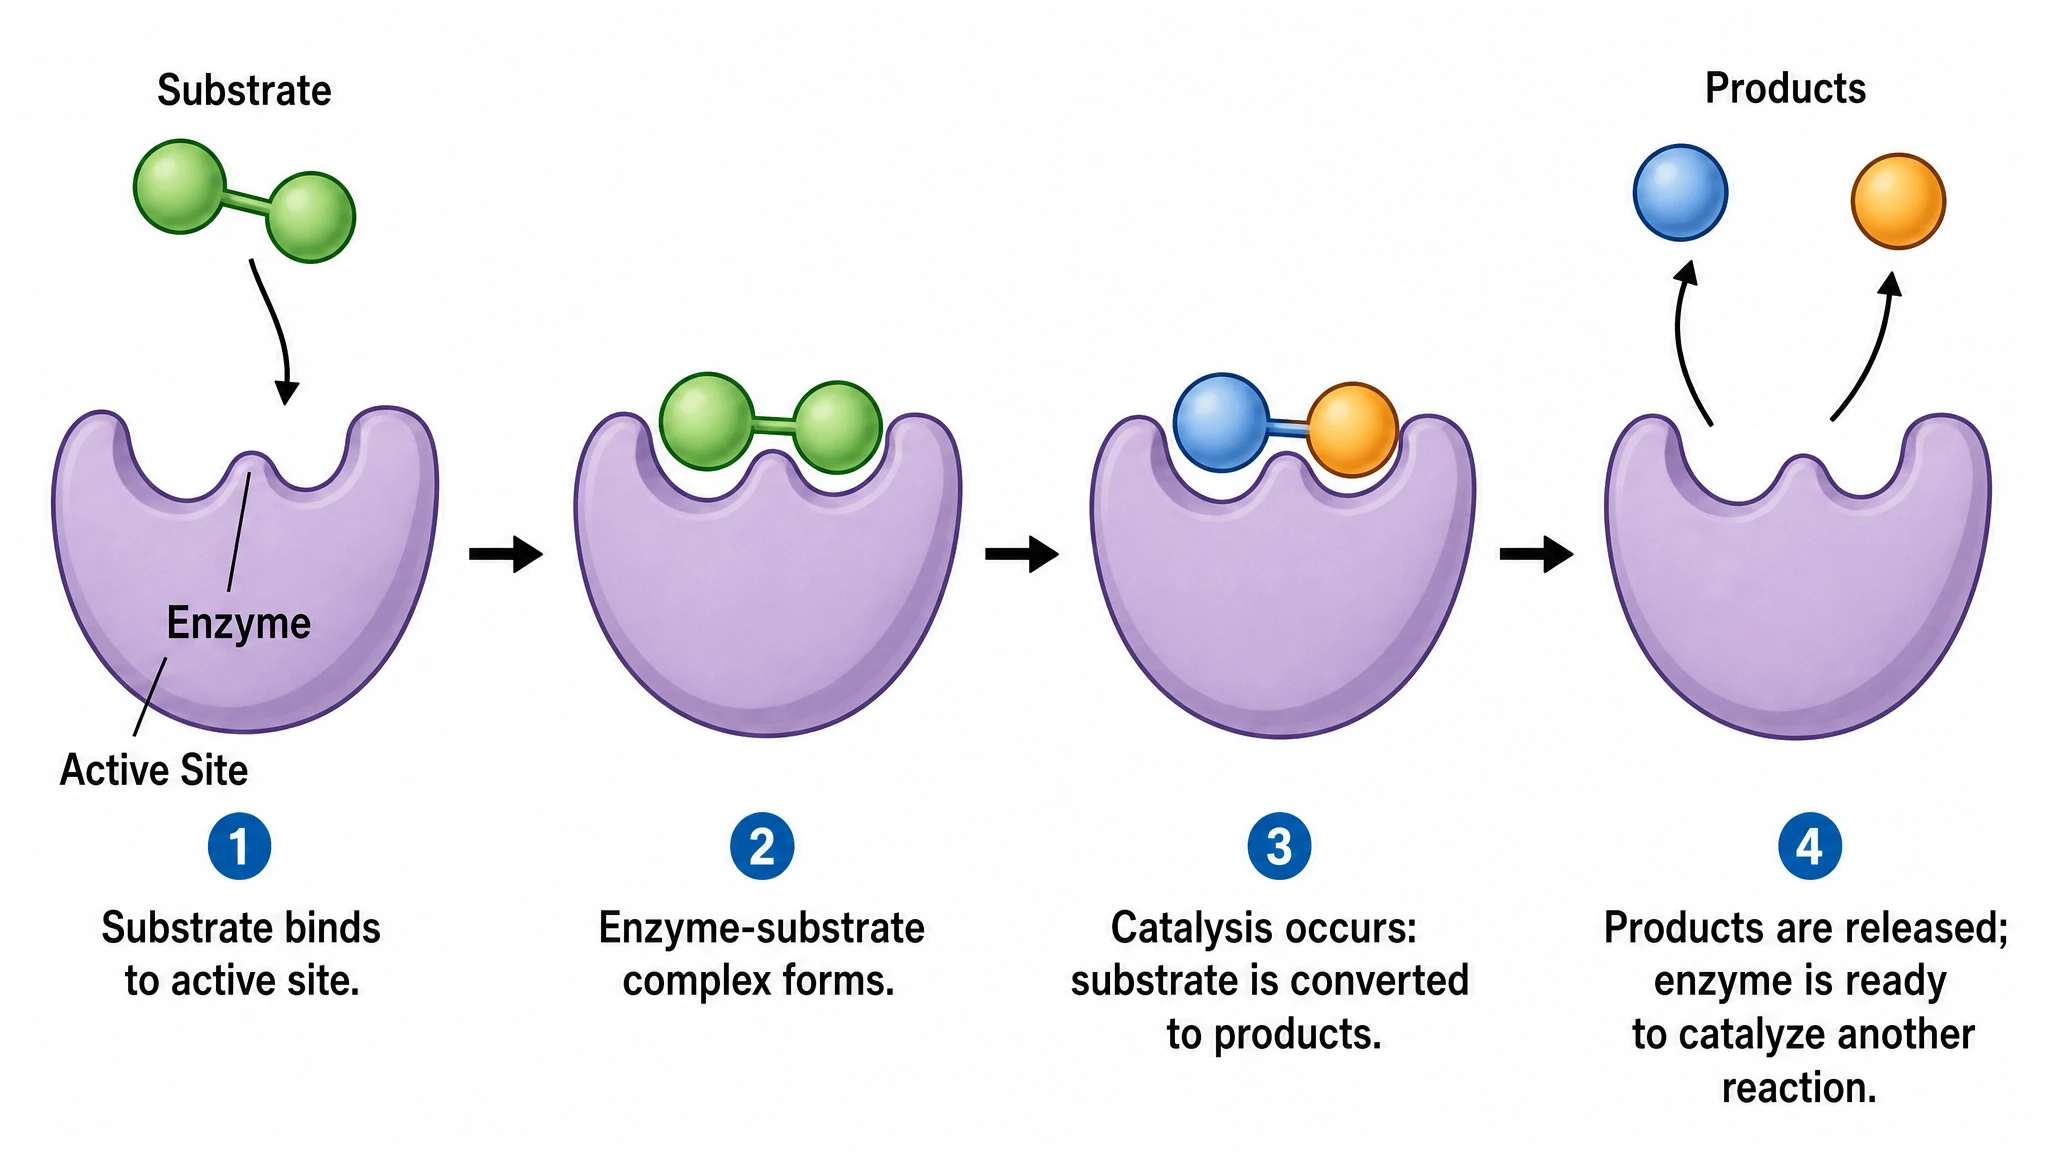
Built for every discipline, not just biology
Biology, chemistry, physics, engineering, medicine — each field gets diagrams that look right for it. A scientific diagram maker that only knows cells and molecules leaves a materials scientist or an electrical engineer stuck; this one does not depend on a fixed asset library.
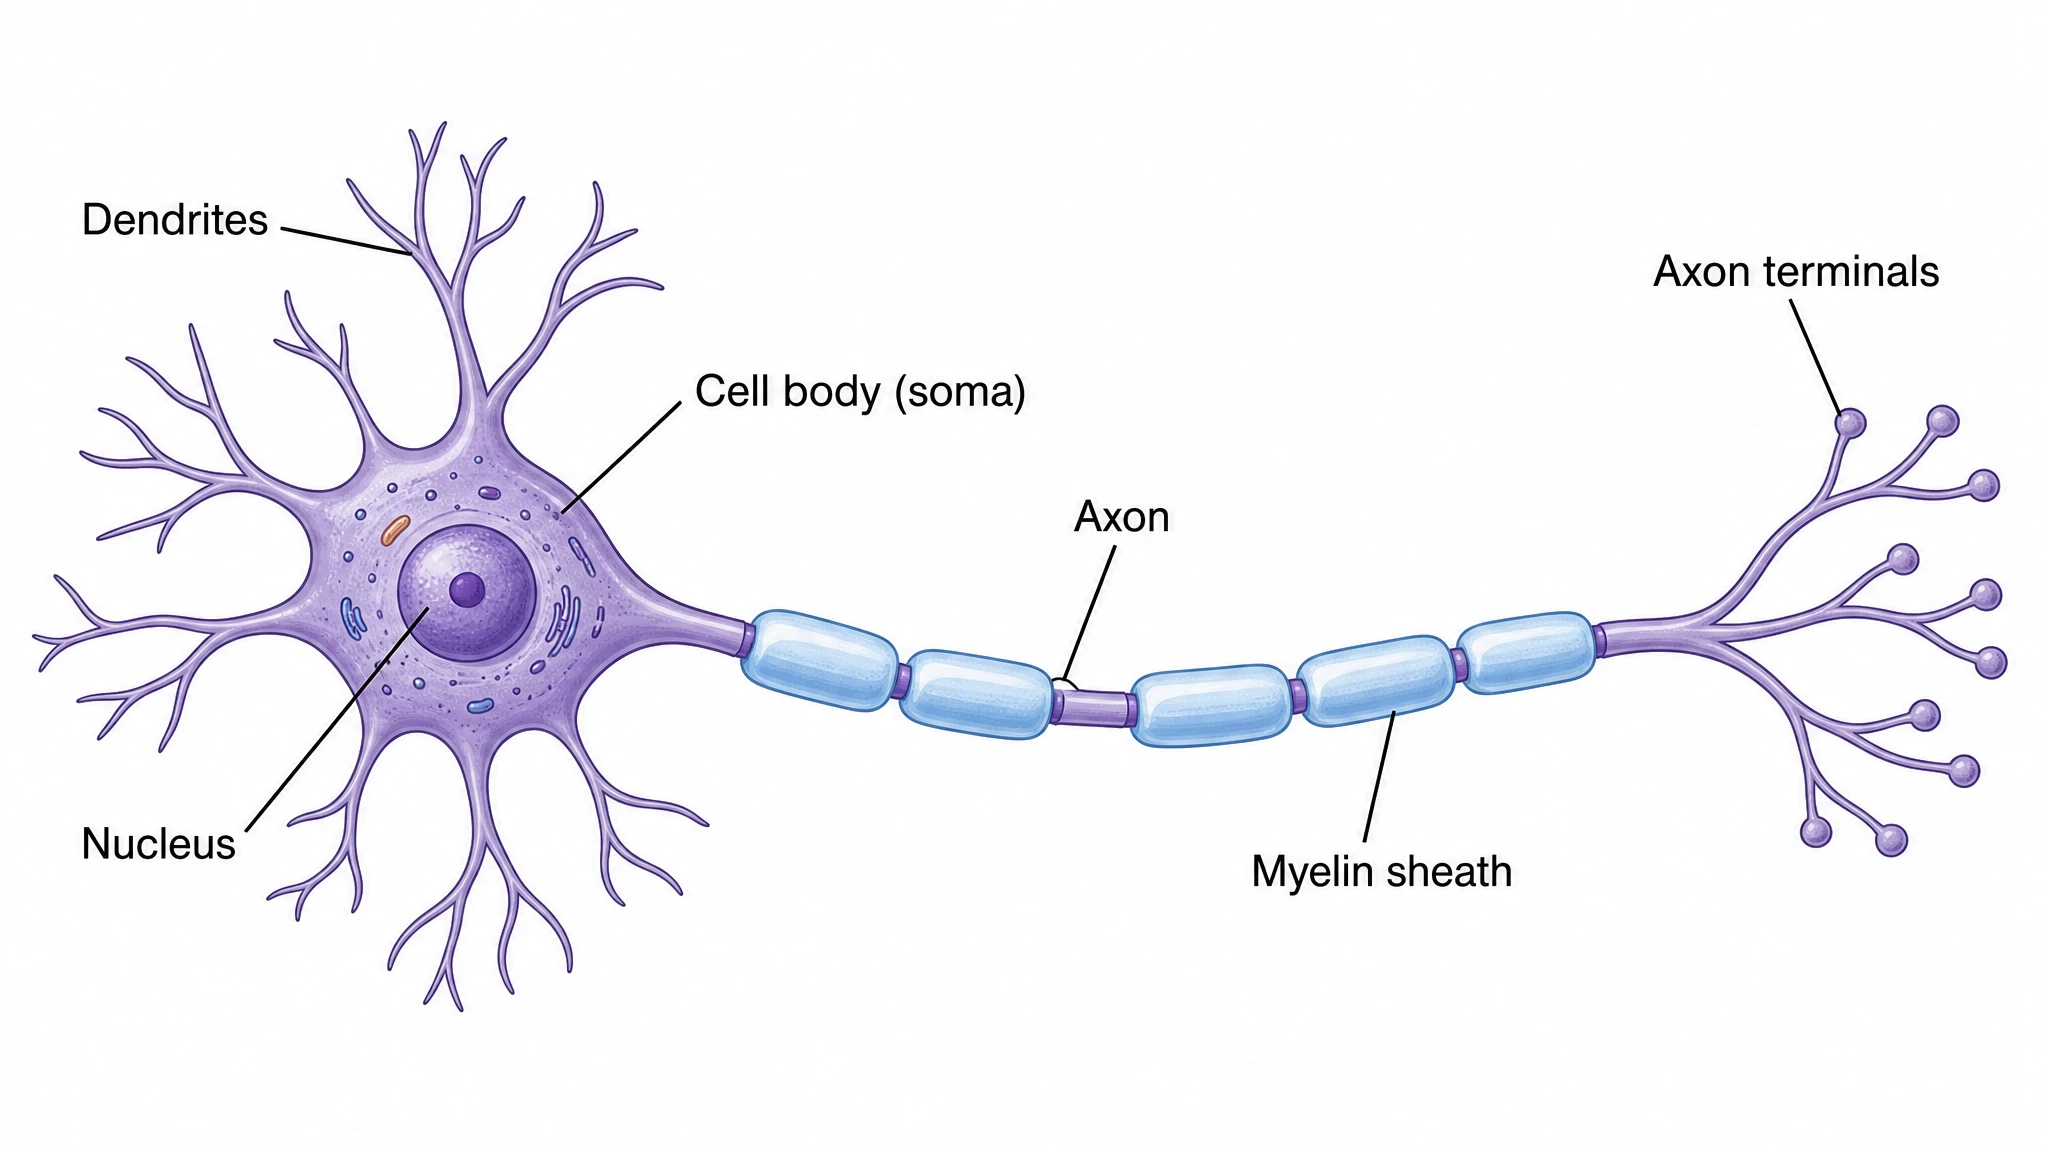
Fully editable before you export
A good ai figure generator keeps you in control. SciFig lets you relabel every element, adjust colors, and refine the layout after the scientific illustration ai produces your first draft. This makes it easy to correct terminology, match a journal's style, or build a series of consistent figures. When you are satisfied, export the scientific image as a high-resolution file for papers or slides. In practice, that makes SciFig a strong figure creator for papers when you need fast iteration without losing scientific control.
What is a science diagram?
A science diagram is a simplified drawing that explains a structure, a process, or a relationship — a reaction scheme, a circuit, a signalling pathway, a study flow. A science diagram maker turns a plain-language description into that drawing and keeps every label editable. Unlike a general image model, this scientific diagram maker is built around the terminology of each field rather than photographic realism.
Why an accurate science diagram matters
- A clear scientific image communicates a mechanism faster and more memorably than paragraphs of text
- Journals, theses, and grant committees expect publication-grade figures that signal scientific rigor
- Inaccurate or fabricated labels in a scientific image undermine credibility and can trigger reviewer rejection
- Editable figures let researchers correct terminology and match each journal's formatting requirements
- AI removes the bottleneck of manual vector illustration, freeing researchers to focus on the science
- Consistent scientific images across a paper or presentation strengthen a cohesive visual narrative
What goes into a generated science diagram
- Subject structure — the molecule, cell, organ, circuit, or system the scientific image depicts
- Accurate proportions and shapes that follow established scientific illustration conventions
- Editable text labels and leader lines identifying each part of the figure
- A clean layout with logical flow, suitable for single-column or full-width journal placement
- A white or neutral background optimized for print and digital publication
- High-resolution export so the scientific image stays sharp at journal and poster scale
- Flat 2D scientific styling free of decorative effects or generic AI-art artifacts
Where science diagrams are used
- Peer-reviewed journal articles and review papers across biology, chemistry, and engineering
- Theses and dissertations needing original figures of experiments, mechanisms, or workflows
- Grant proposals and research presentations that require clear, credible scientific visuals
- Conference posters and lecture slides illustrating methods and results
- Textbooks, course materials, and open educational resources for STEM teaching
- Preprints and lab websites where polished figures improve readership and citations
- Biology diagrams, mechanism figures, and paper-ready schematics for researchers who need software to make figures for scientific papers
How to make a science diagram
Describe your science diagram
Tell SciFig what to draw in plain language — no design tools required.
Generate with SciFig
Get a clean, publication-ready figure that matches your description in seconds.
Edit & export
Vectorize it into editable SVG, relabel everything, and export for your paper, poster, or slides.
Science Diagram Maker for Every Discipline — Frequently Asked Questions
Common questions about Science Diagram Maker for Every Discipline.
More tools
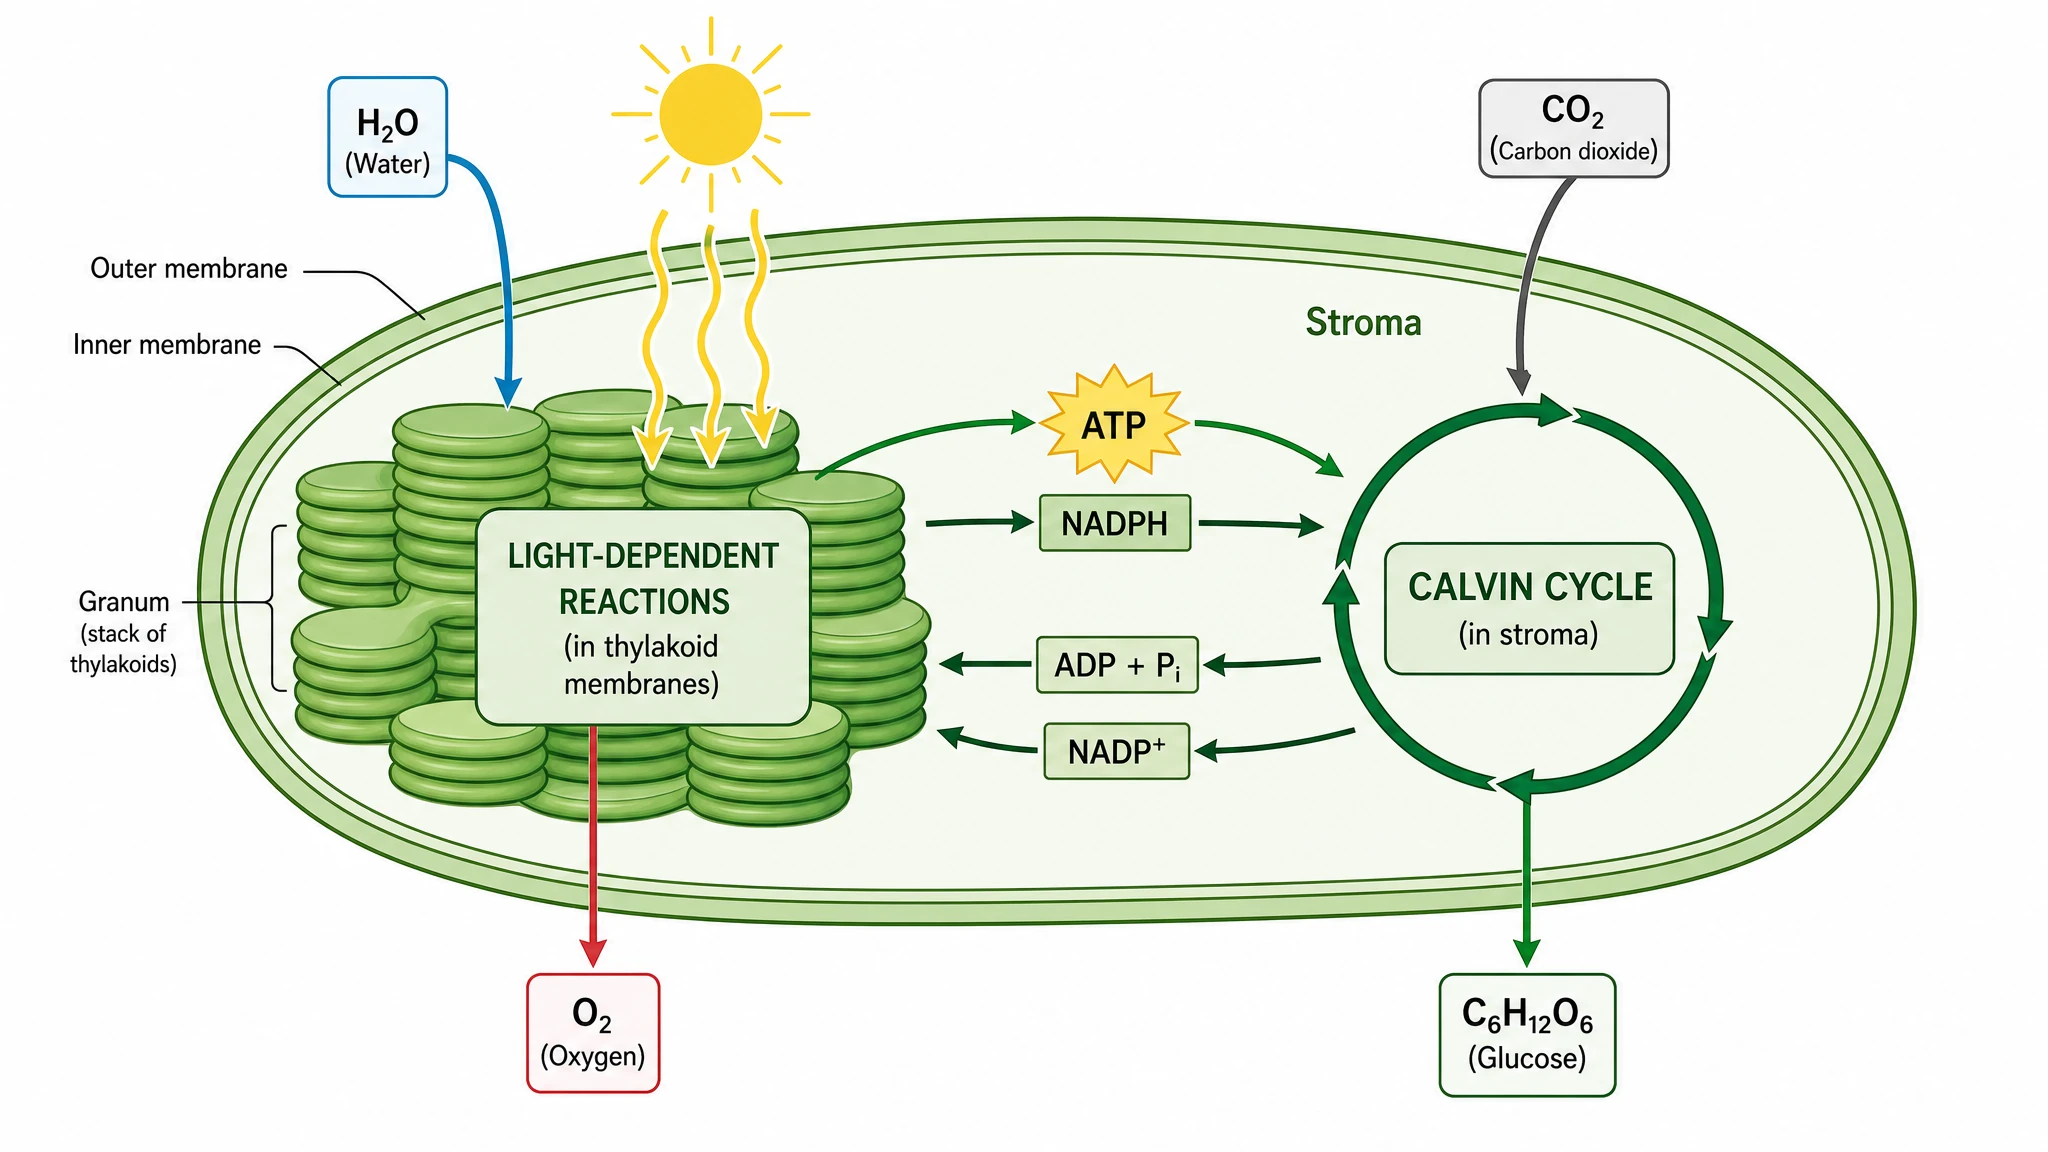
Photosynthesis Diagram Generator
Generate clear photosynthesis diagram figures showing the light-dependent reactions, Calvin cycle, and chloroplast structure — labeled or blank for class, worksheets, or research.
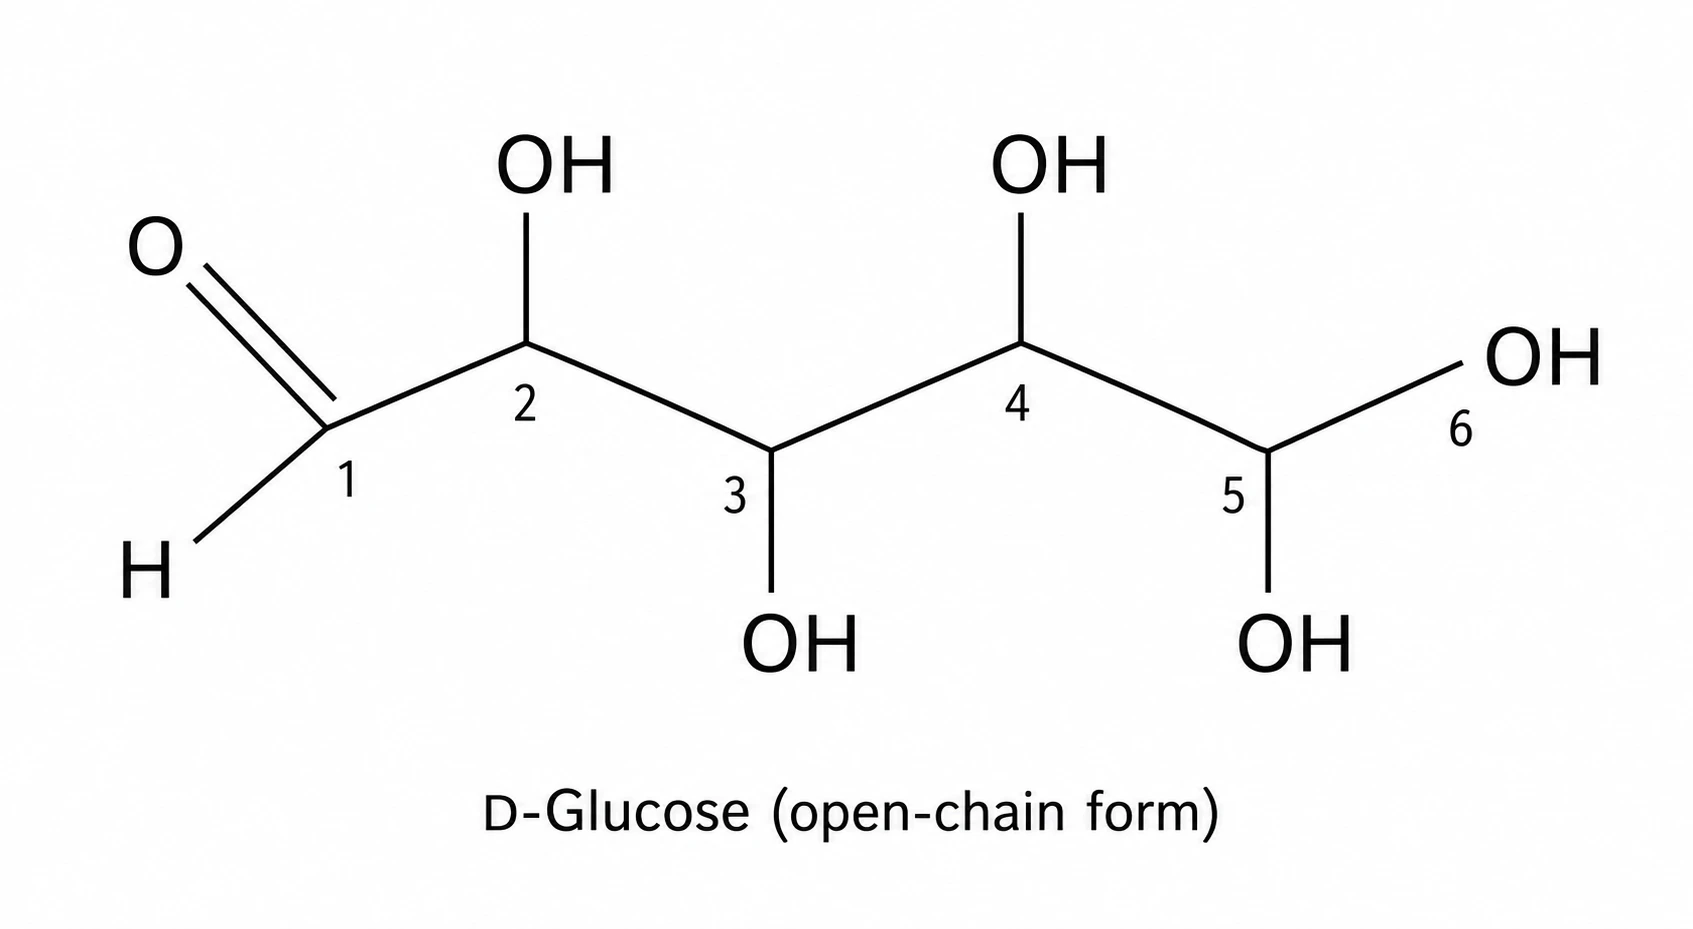
Chemistry Structure Generator
Generate accurate chemistry structure diagrams — skeletal formulas, organic compound structures, and line-bond figures — publication-ready in seconds.

Free Body Diagram Generator
Create accurate, publication-ready free body diagrams with labeled force vectors for weight, normal force, friction, and tension in seconds.
Home
Free AI Scientific Figure Generator and Figure Maker — Create Research Figures, Images, Illustrations and Diagrams
Text-to-Figure
Generate a figure from a plain-language description
Models
Default to GPT Image 2 for journal papers; switch to Nano Banana Pro for slides and posters; pick Nano Banana 2 for routine figure work
Tutorials
Seven short walkthroughs of the AI scientific figure generator
Blog
Tutorials, tool comparisons, and publication tips for researchers.
Inspiration
Explore publication-ready scientific figure examples, copy the prompts, and use them as starting points for your own work.

Ready to publish?
Make your own science diagram in minutes.
Start for freeFree to start · No credit card required · Built for researchers