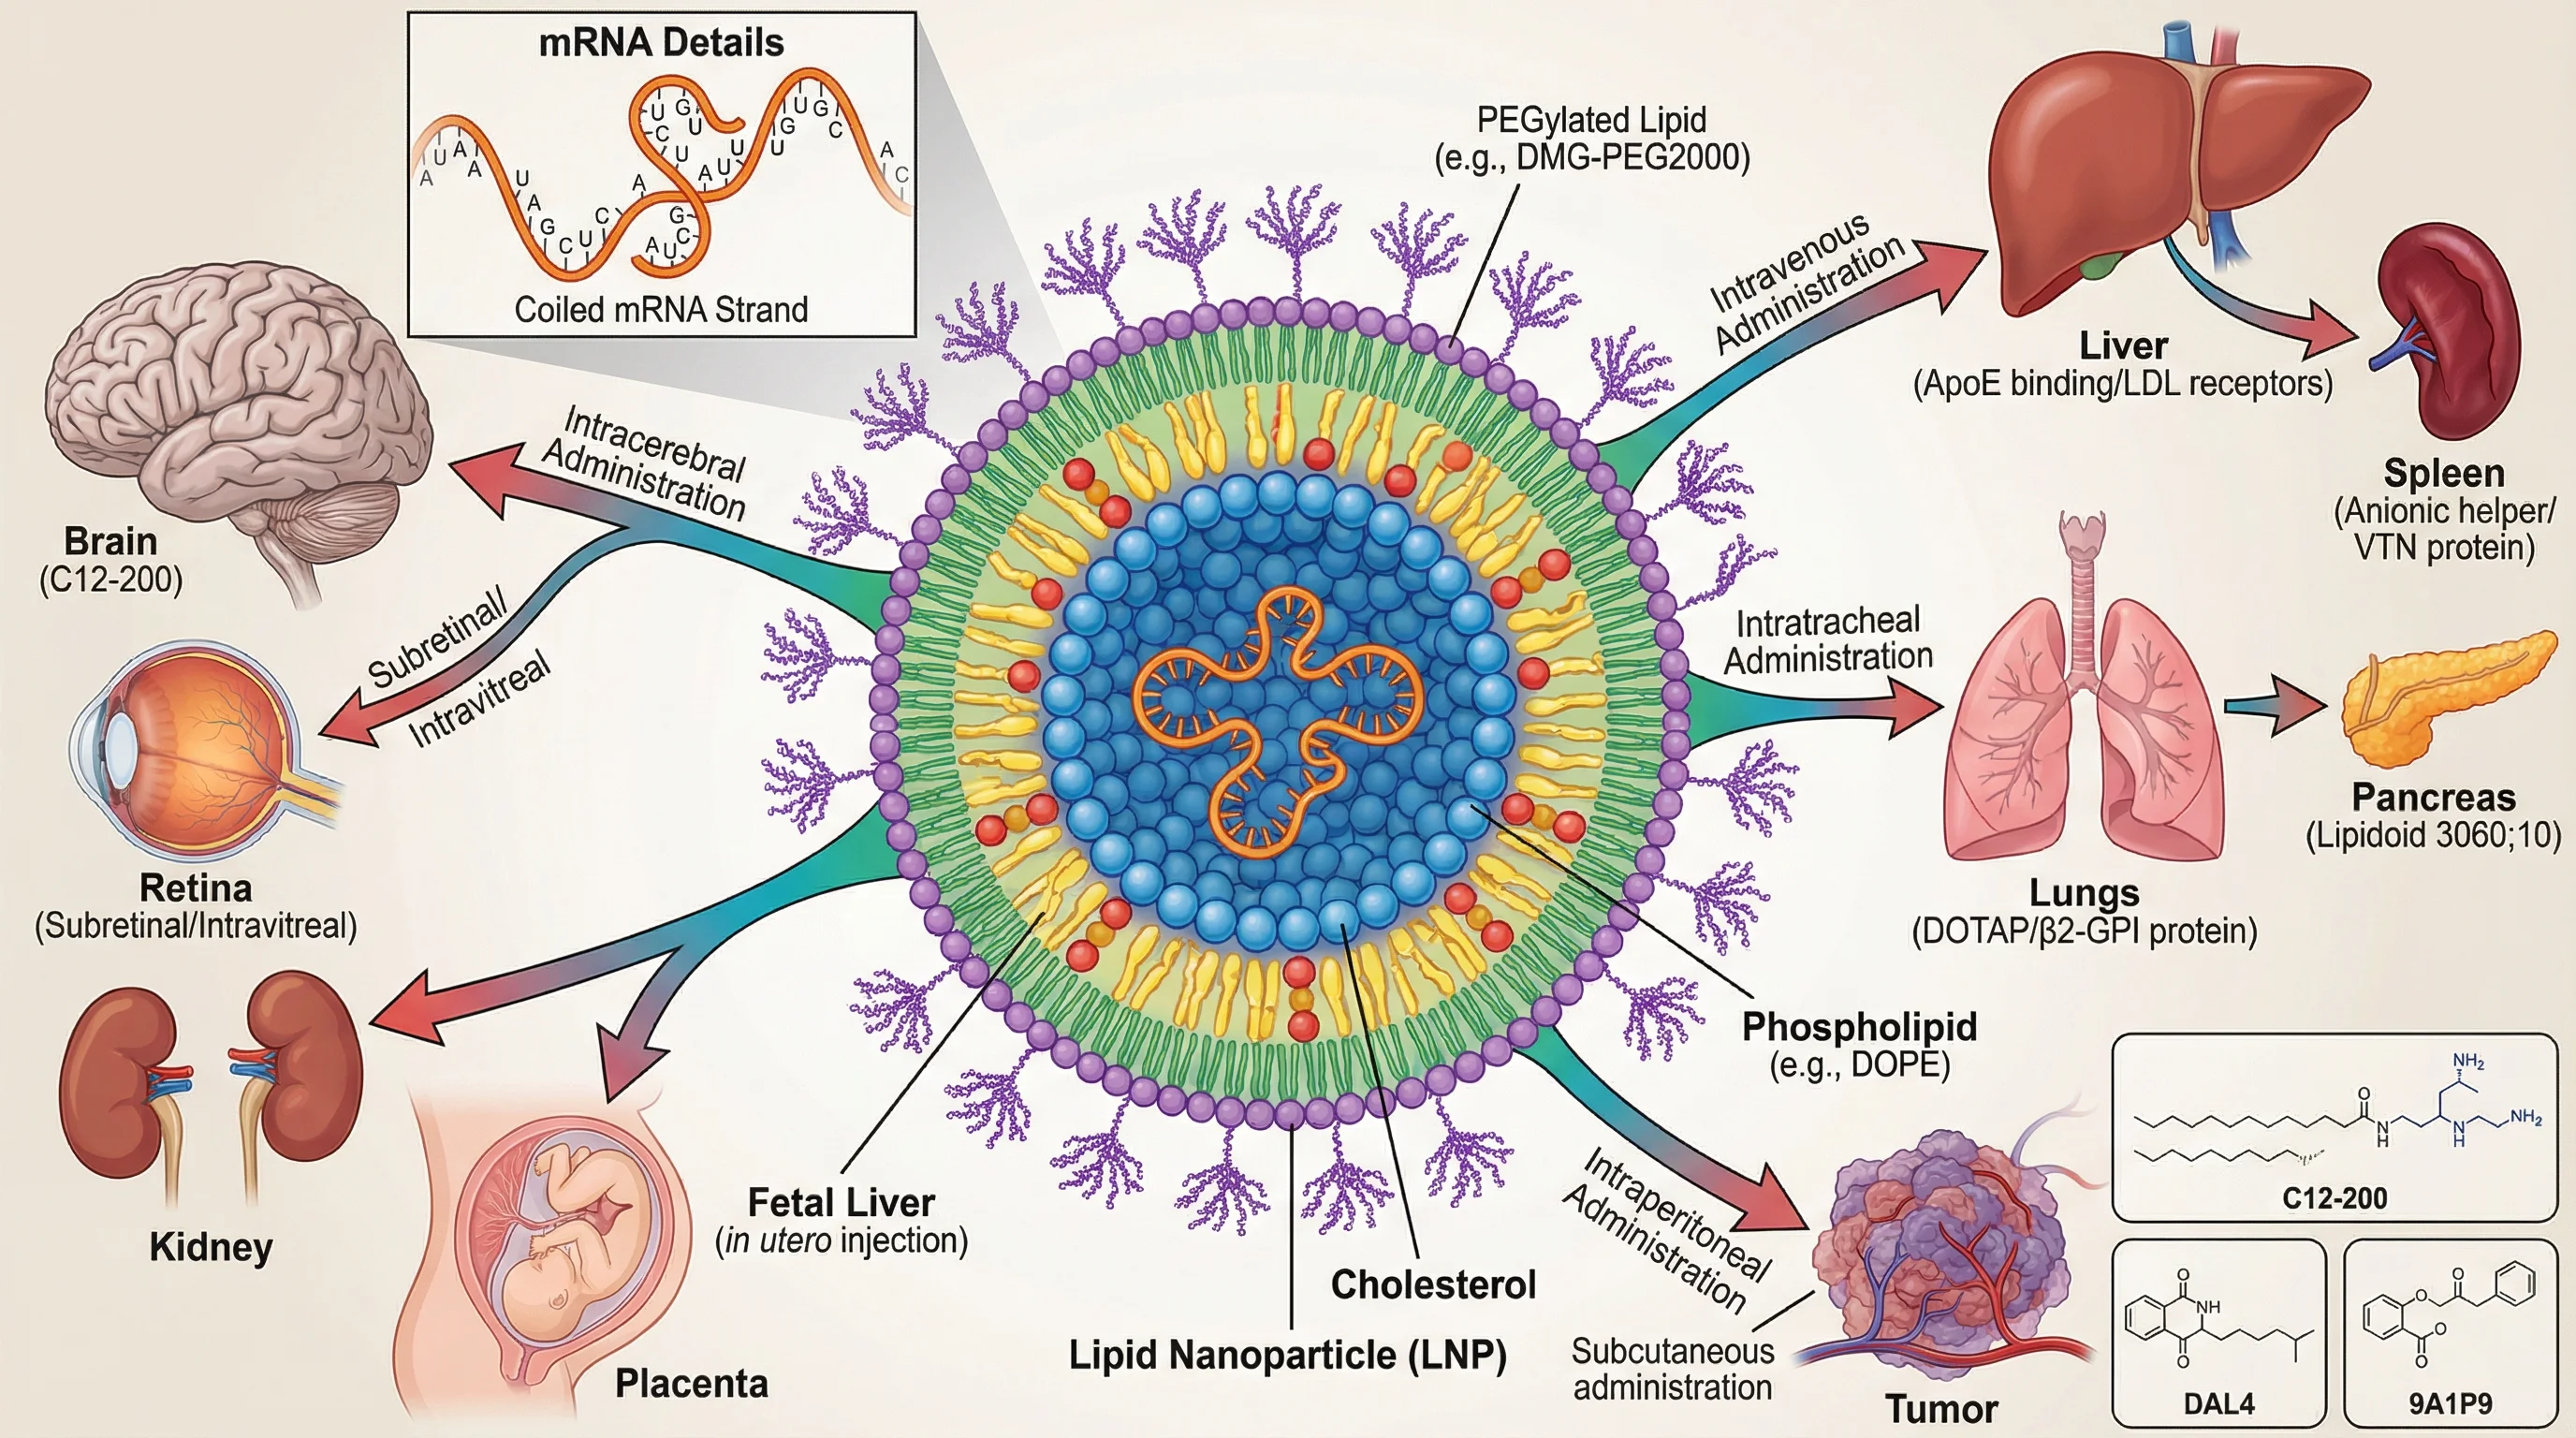
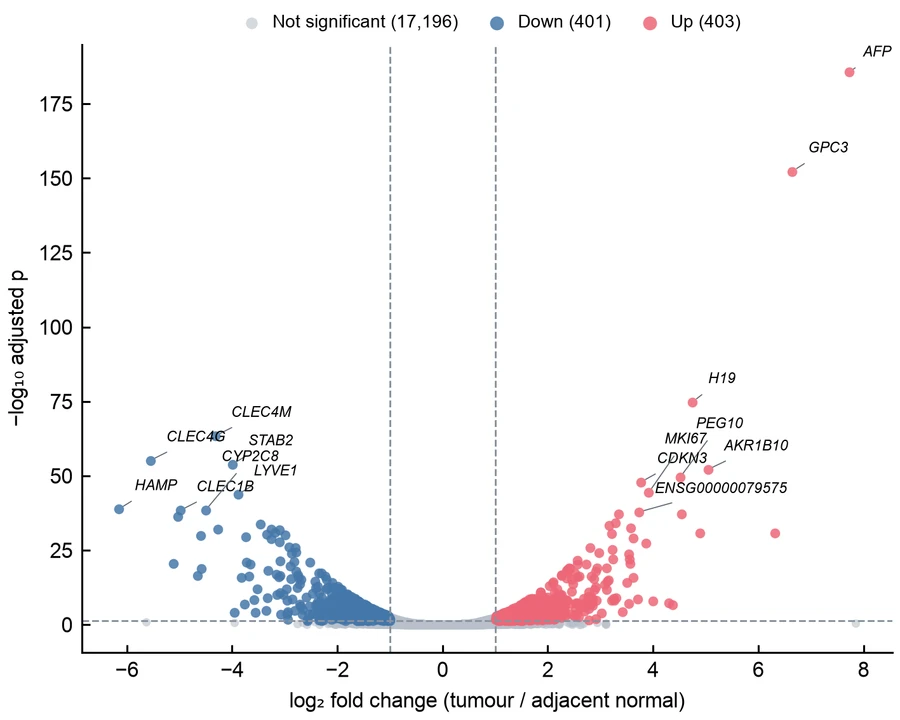
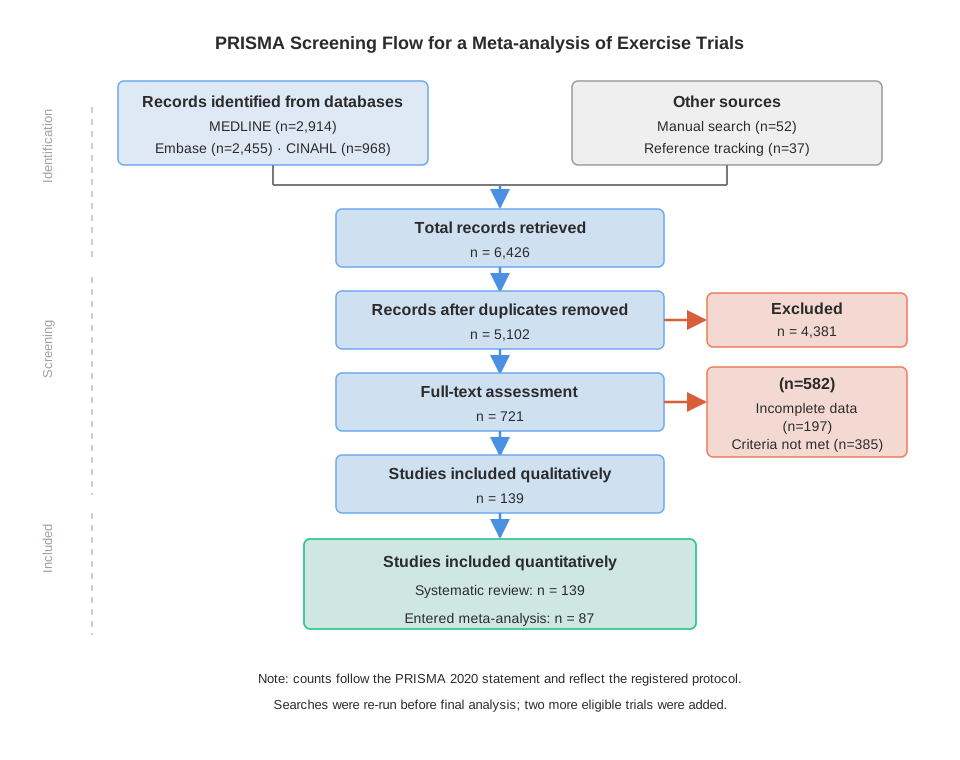
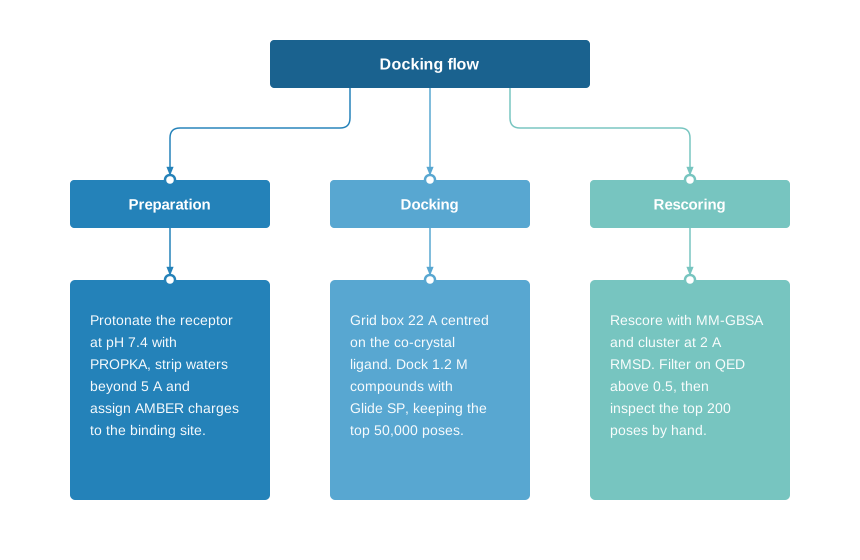
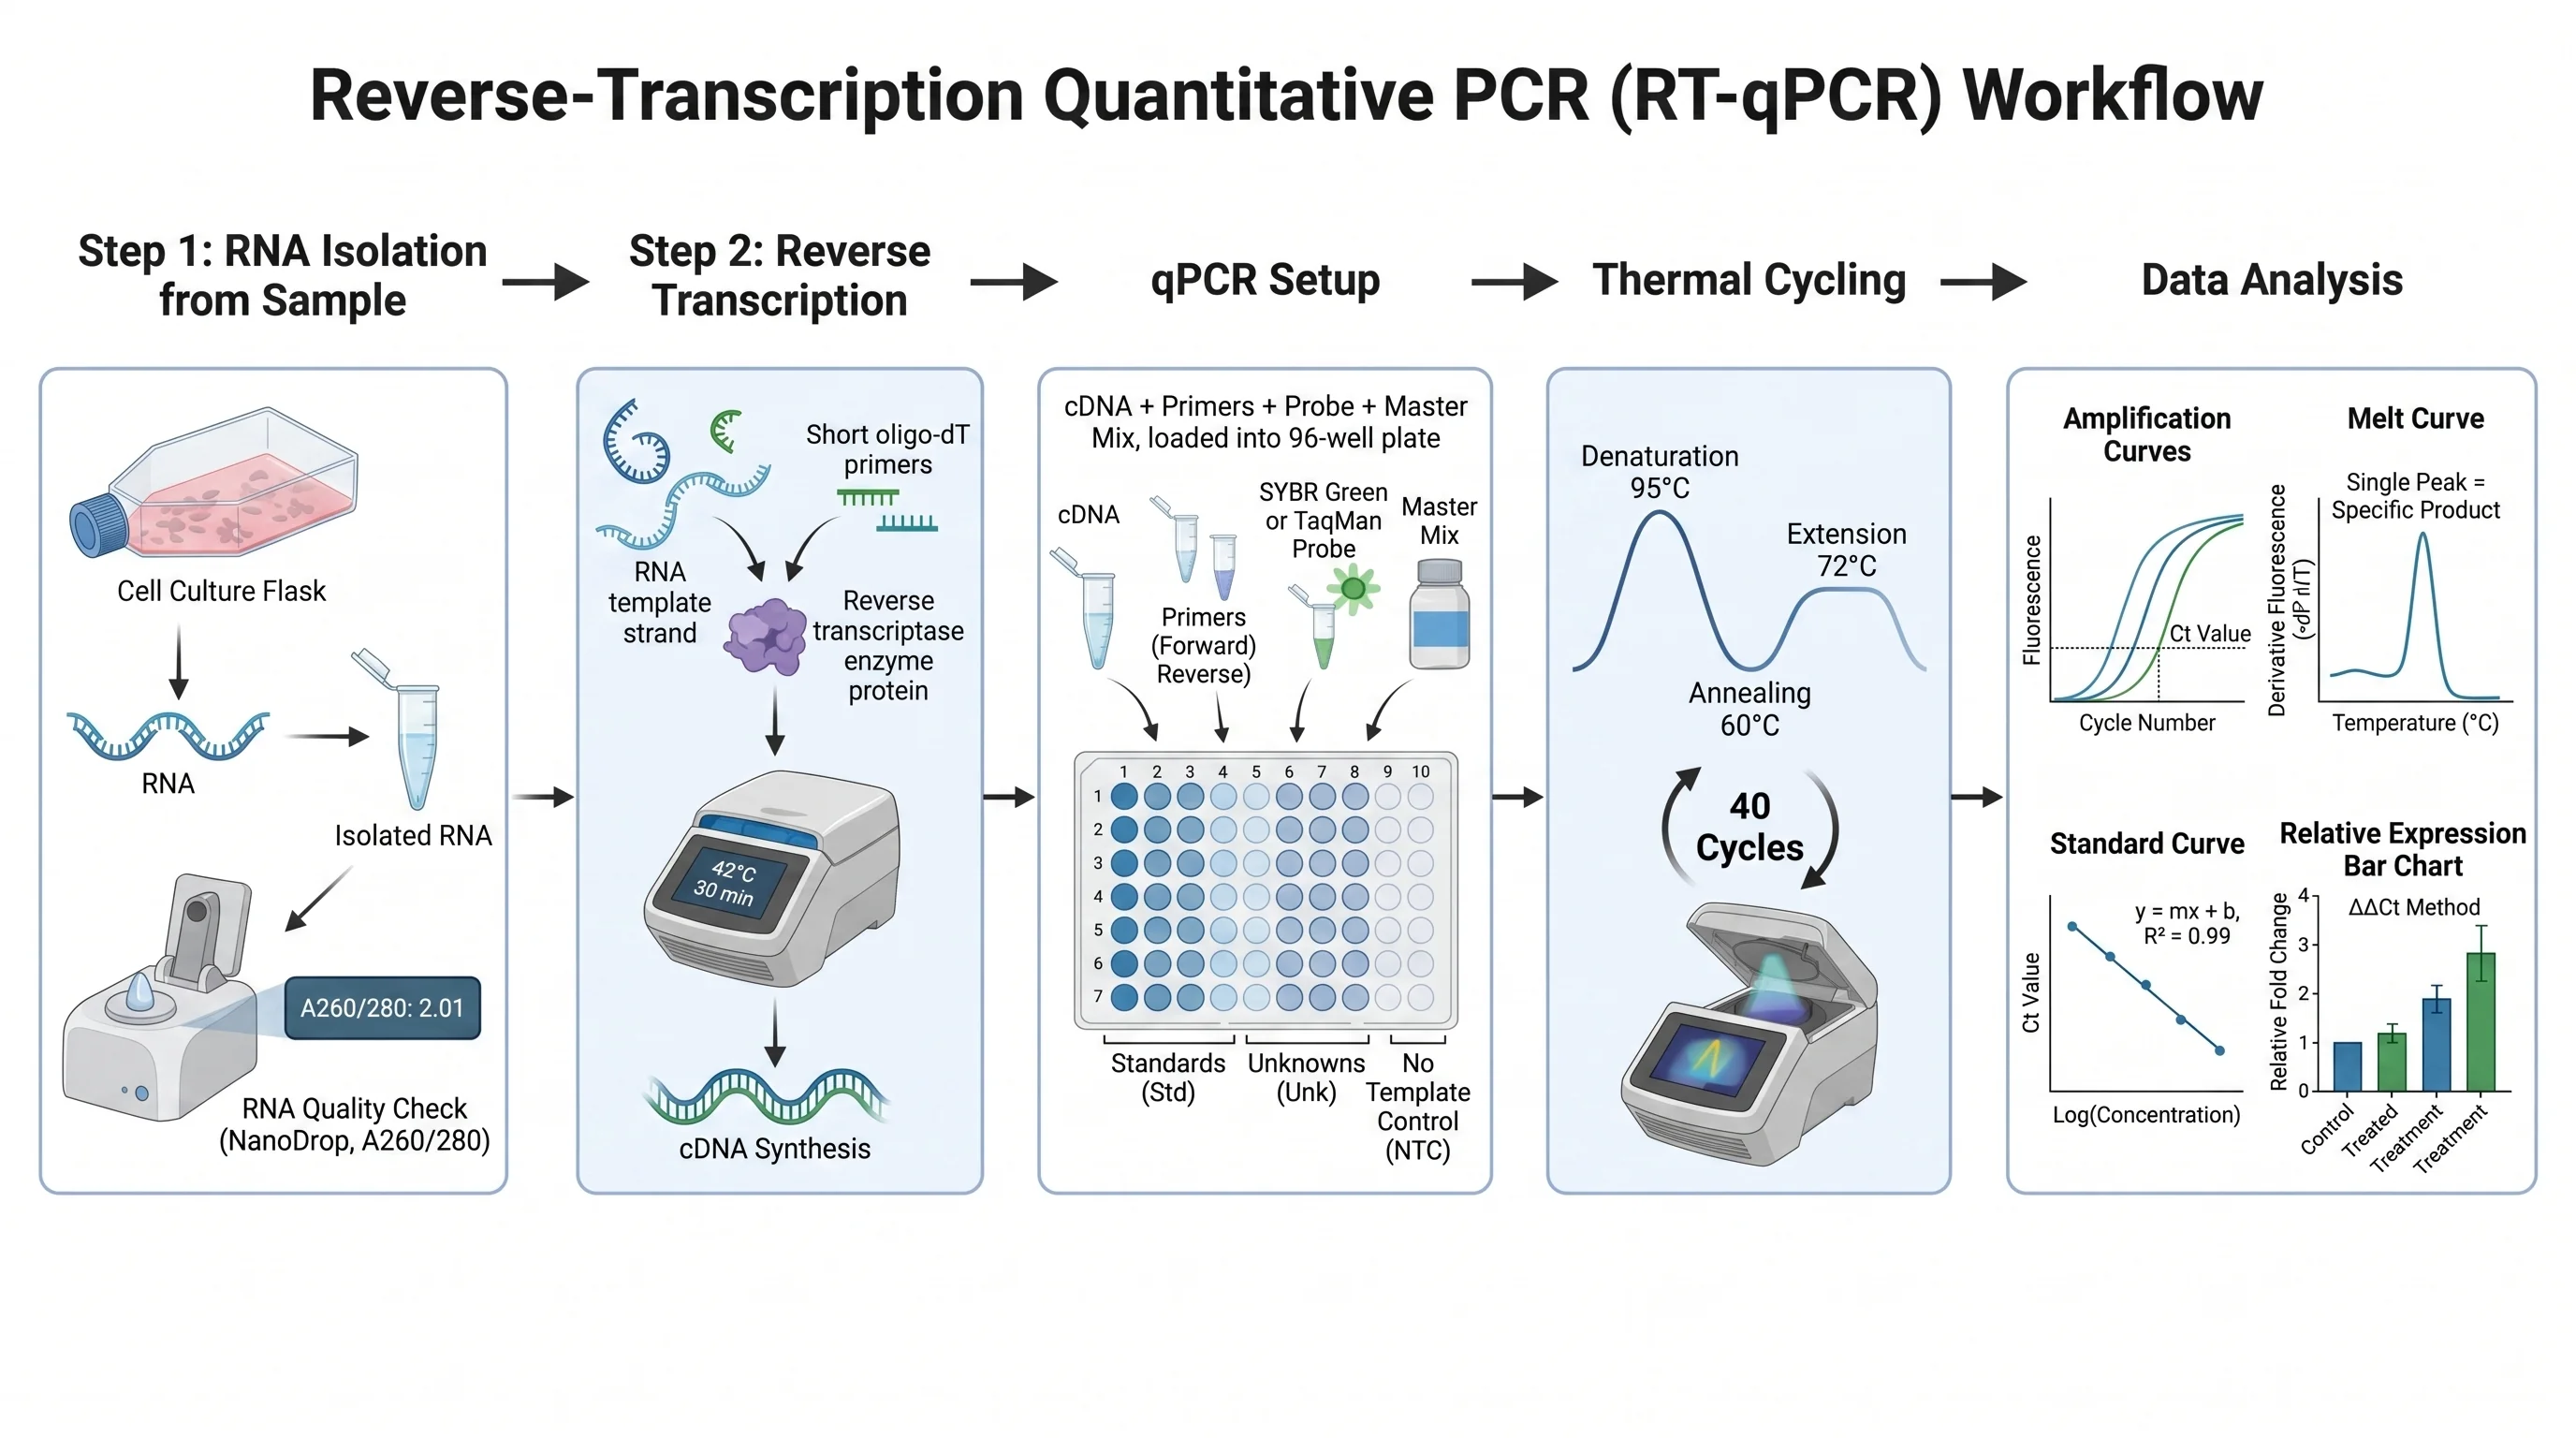
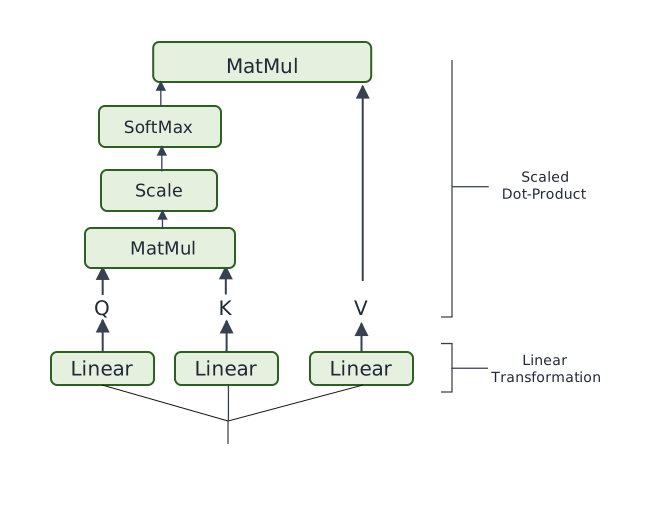
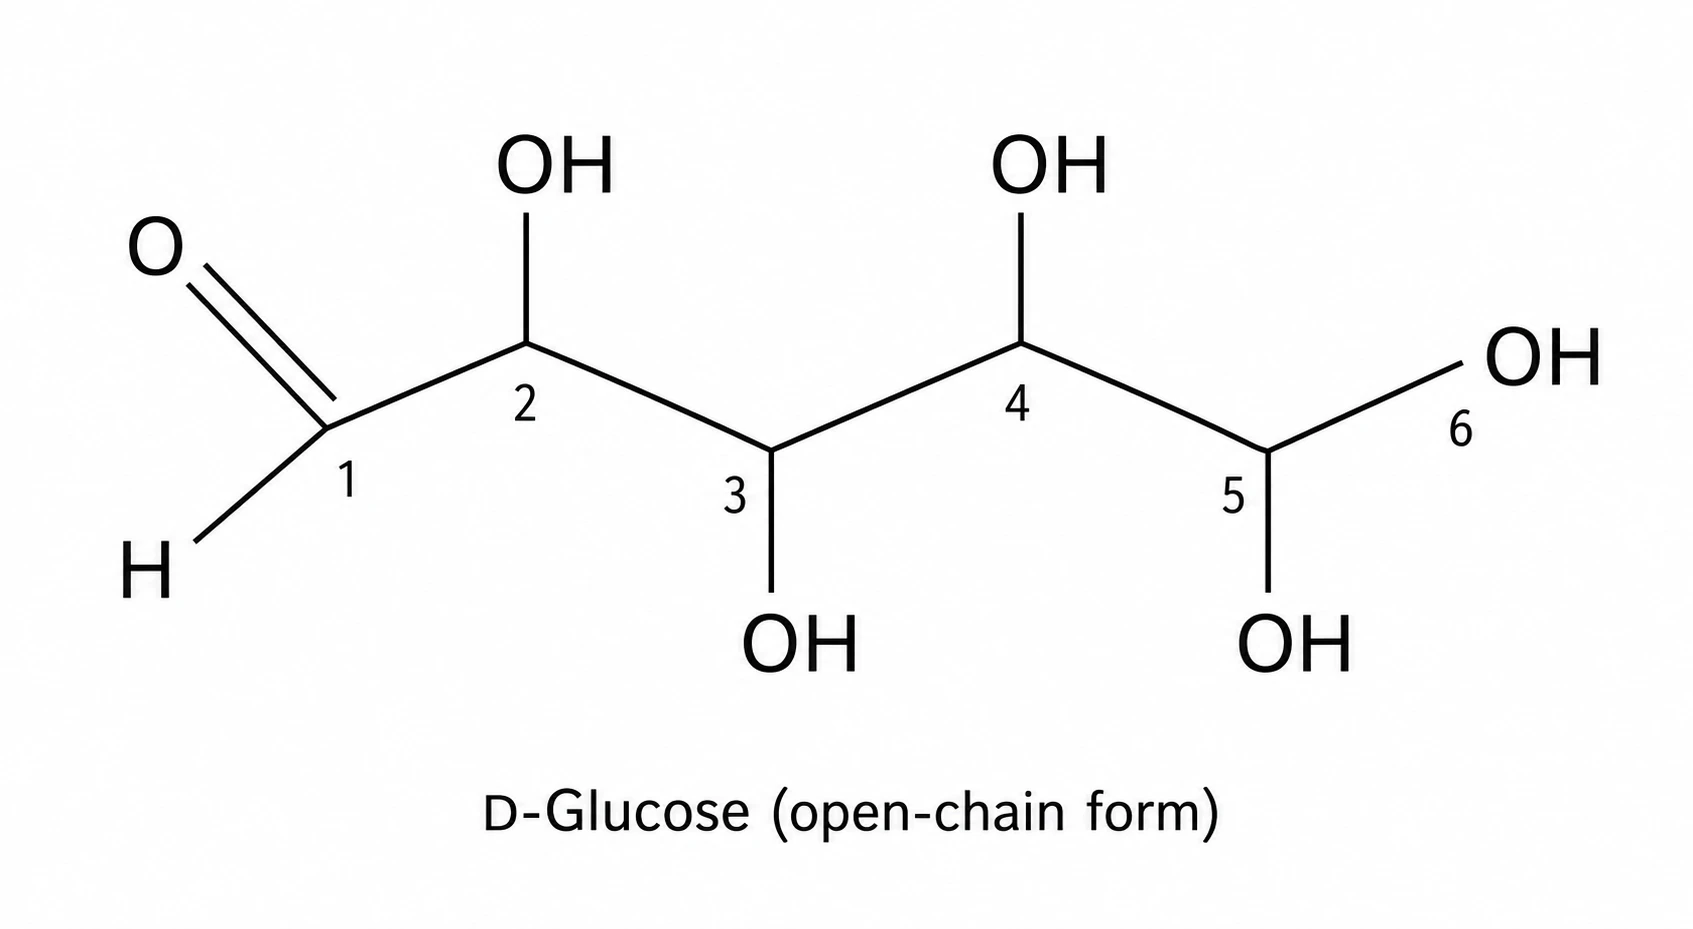
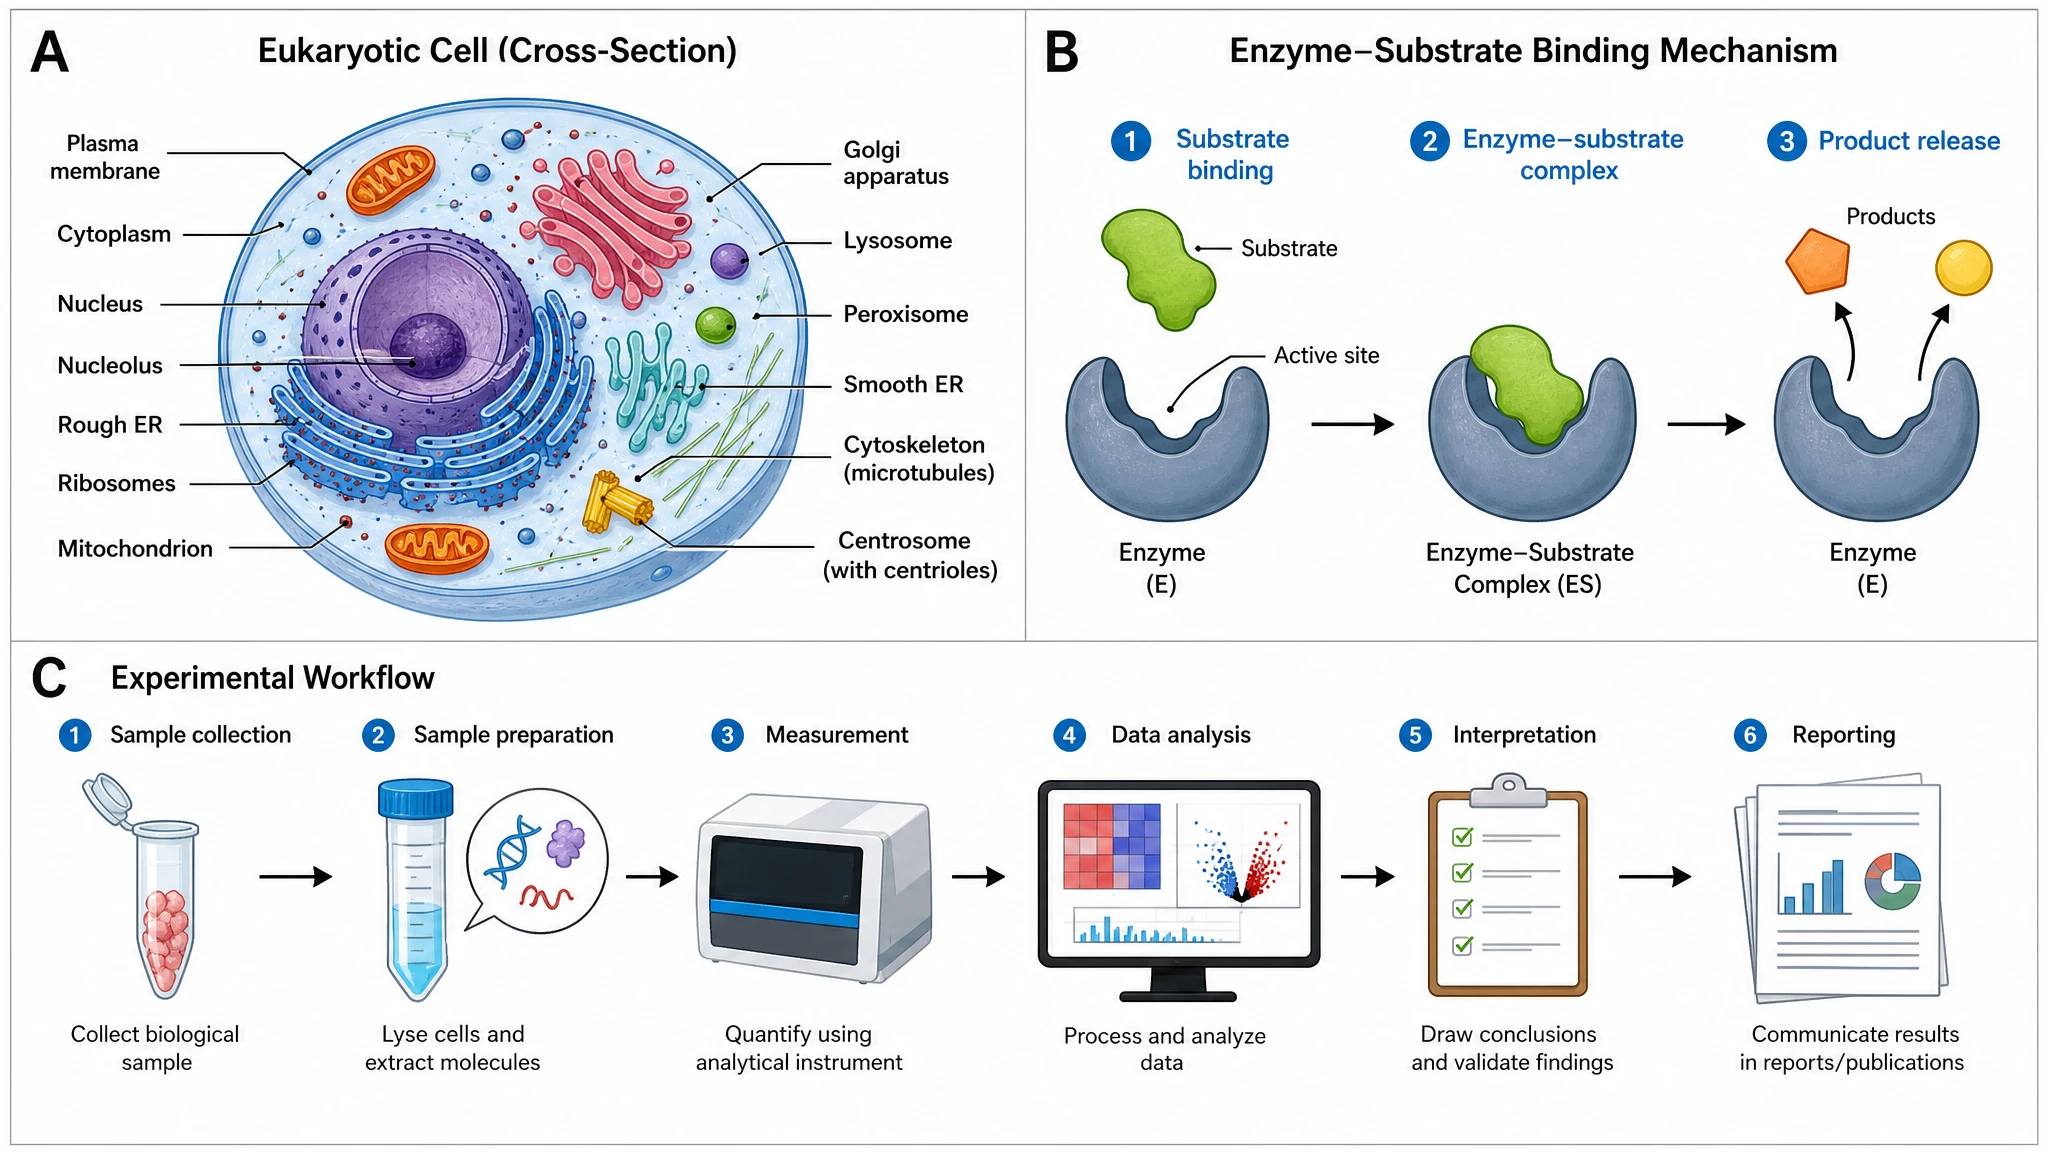
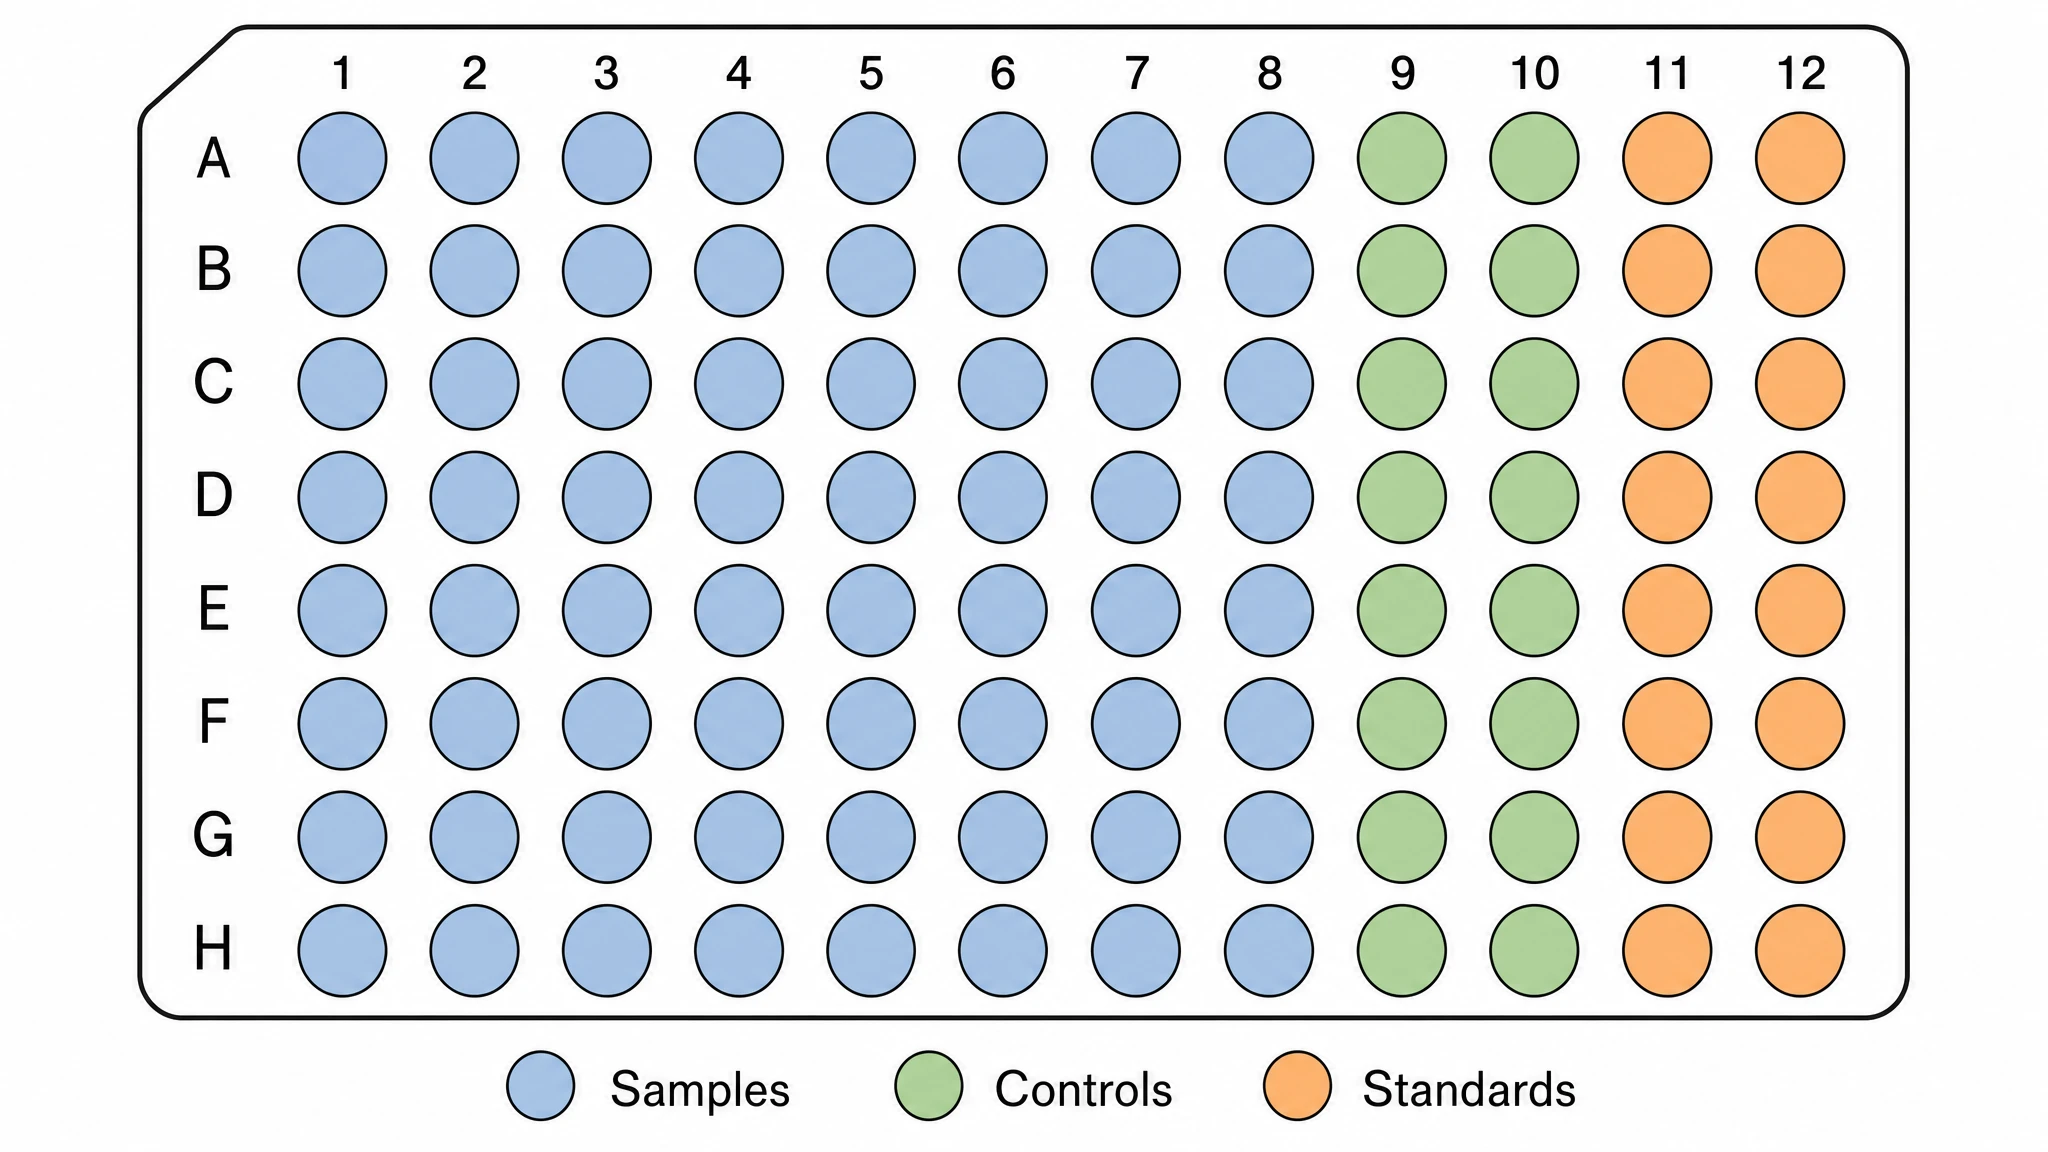
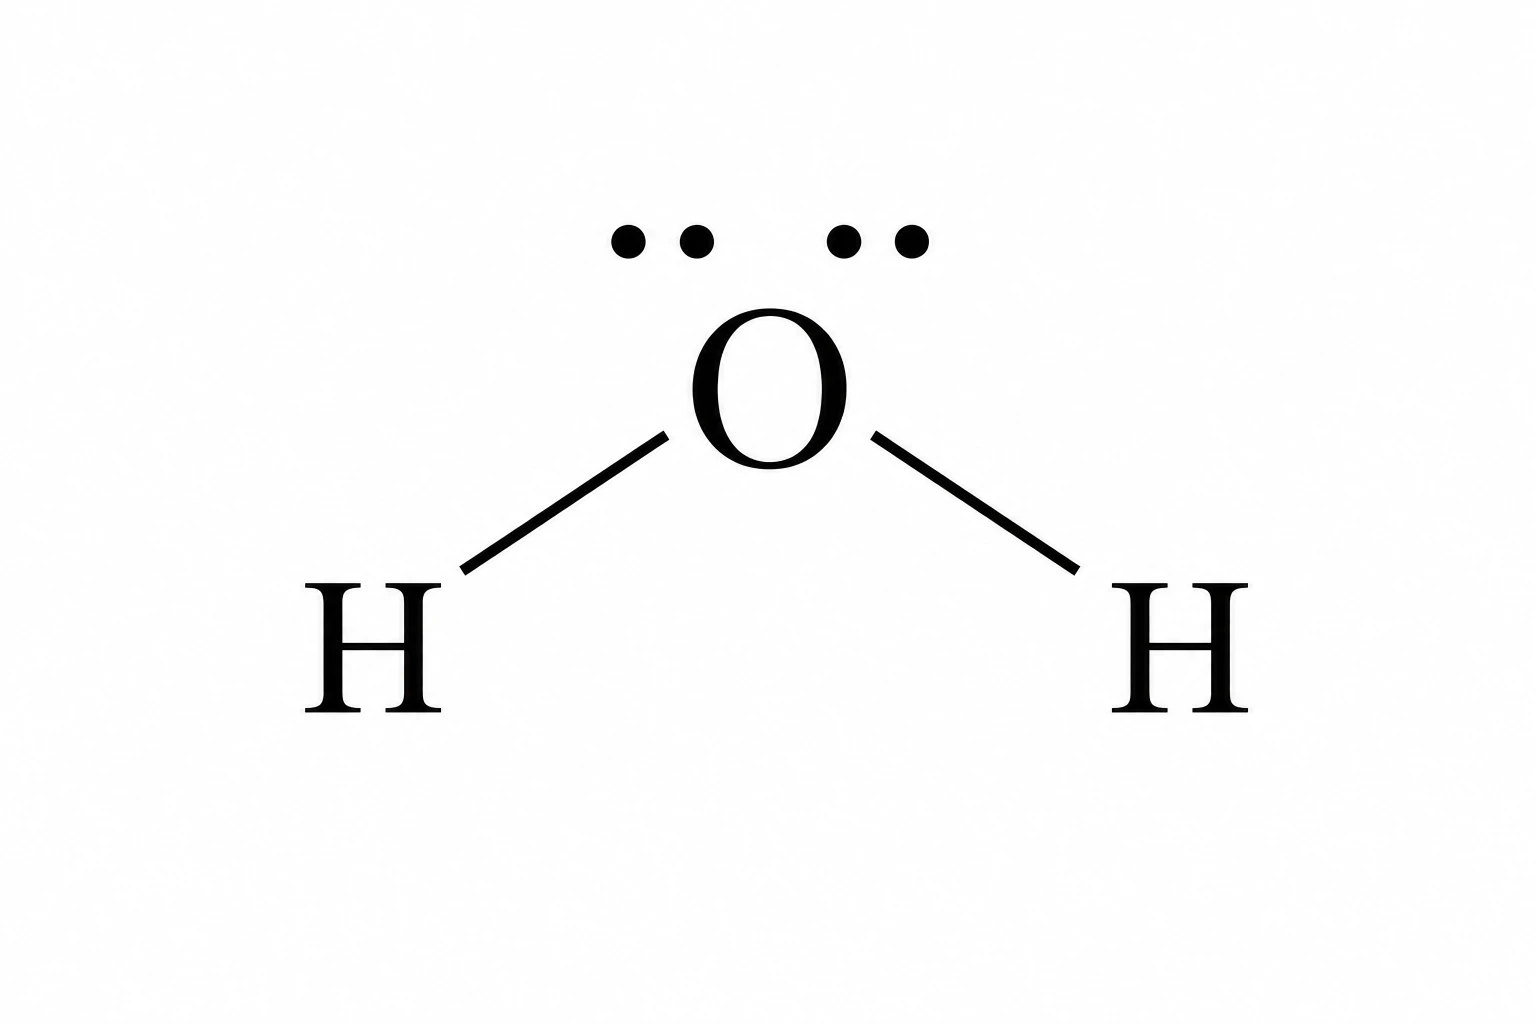
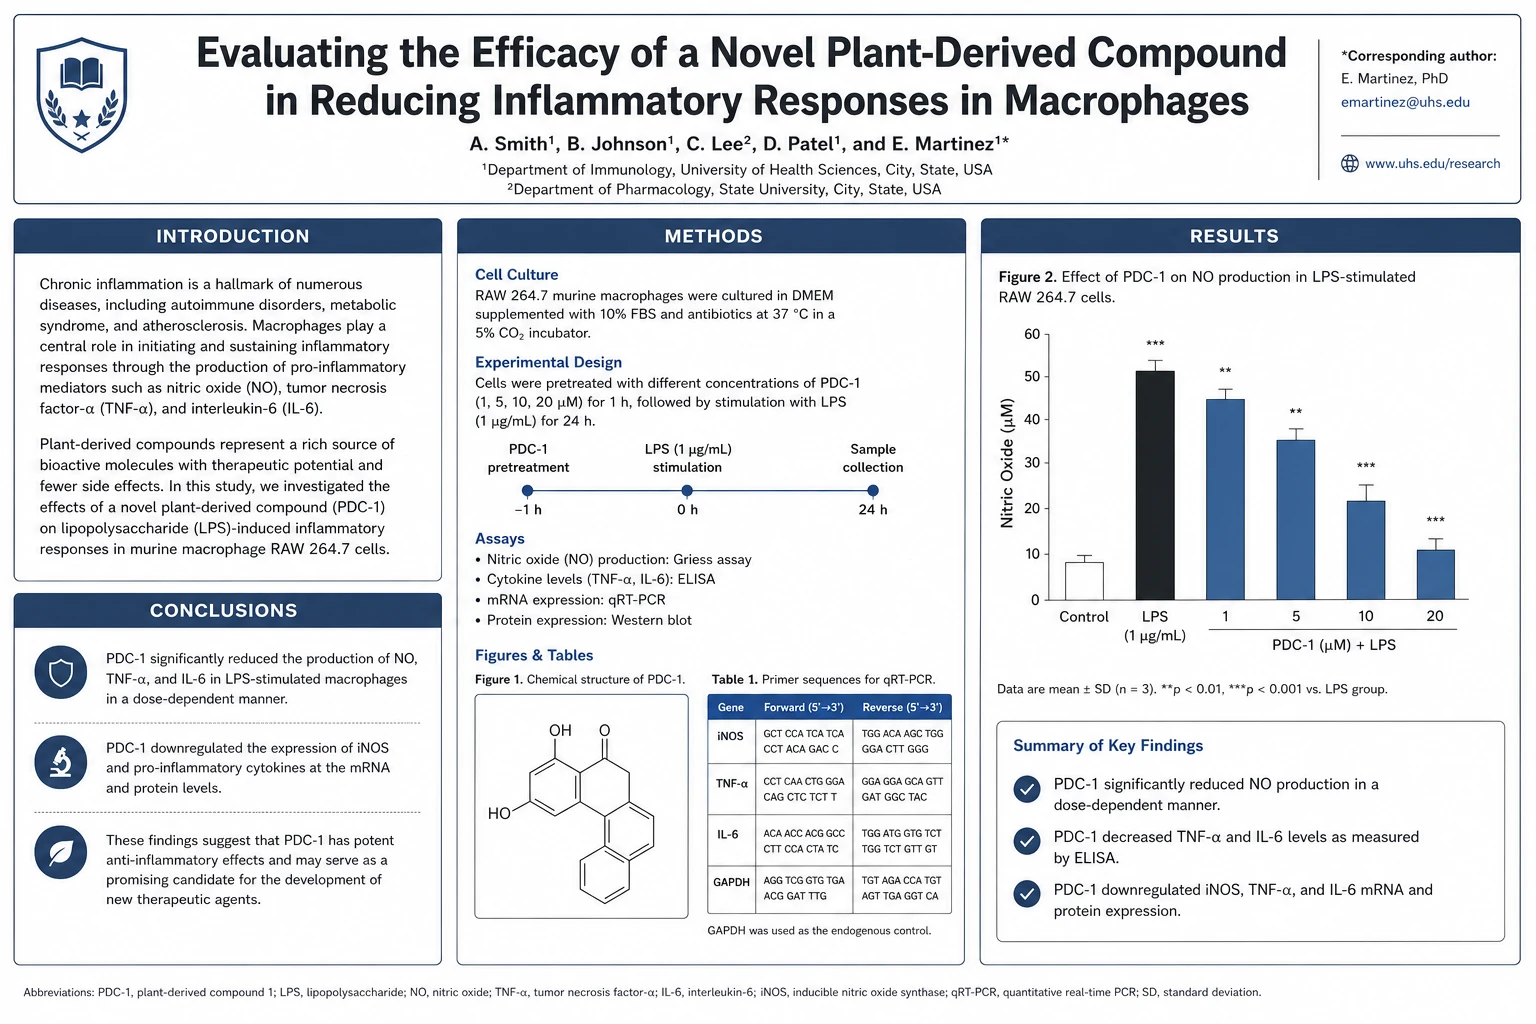
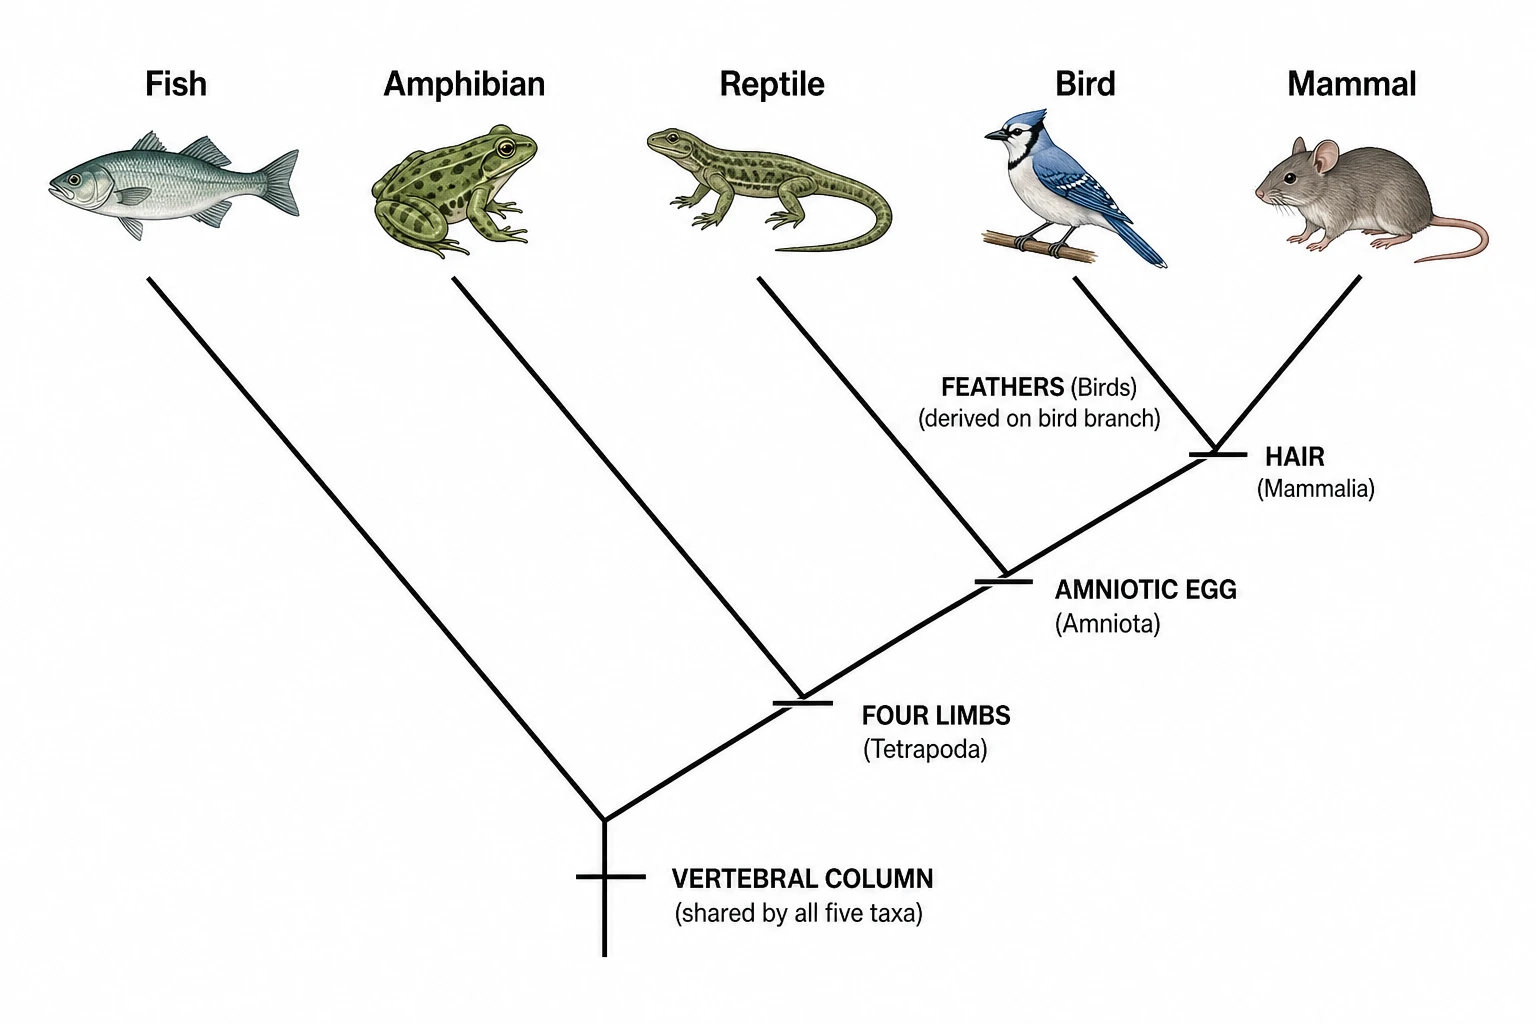
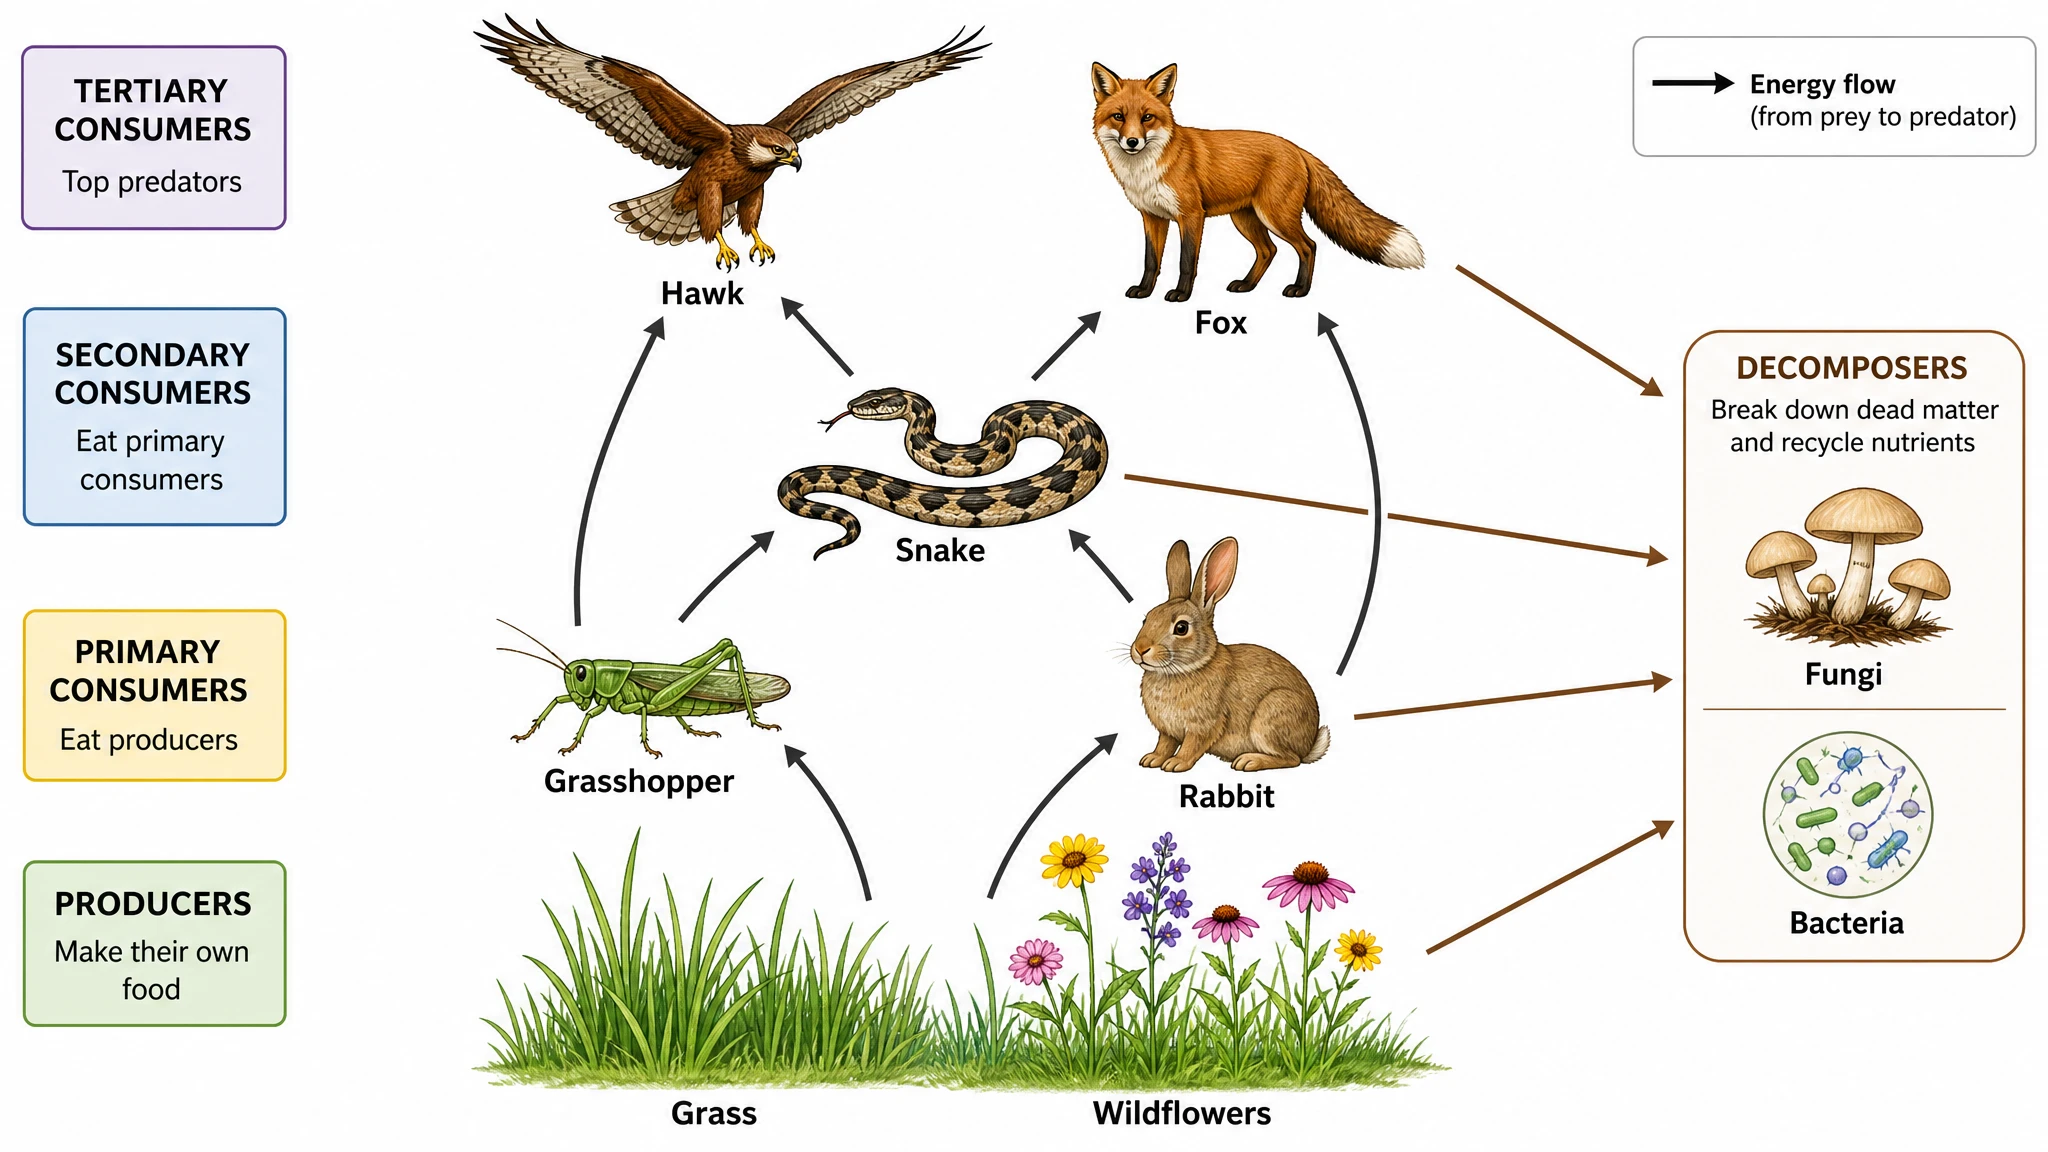
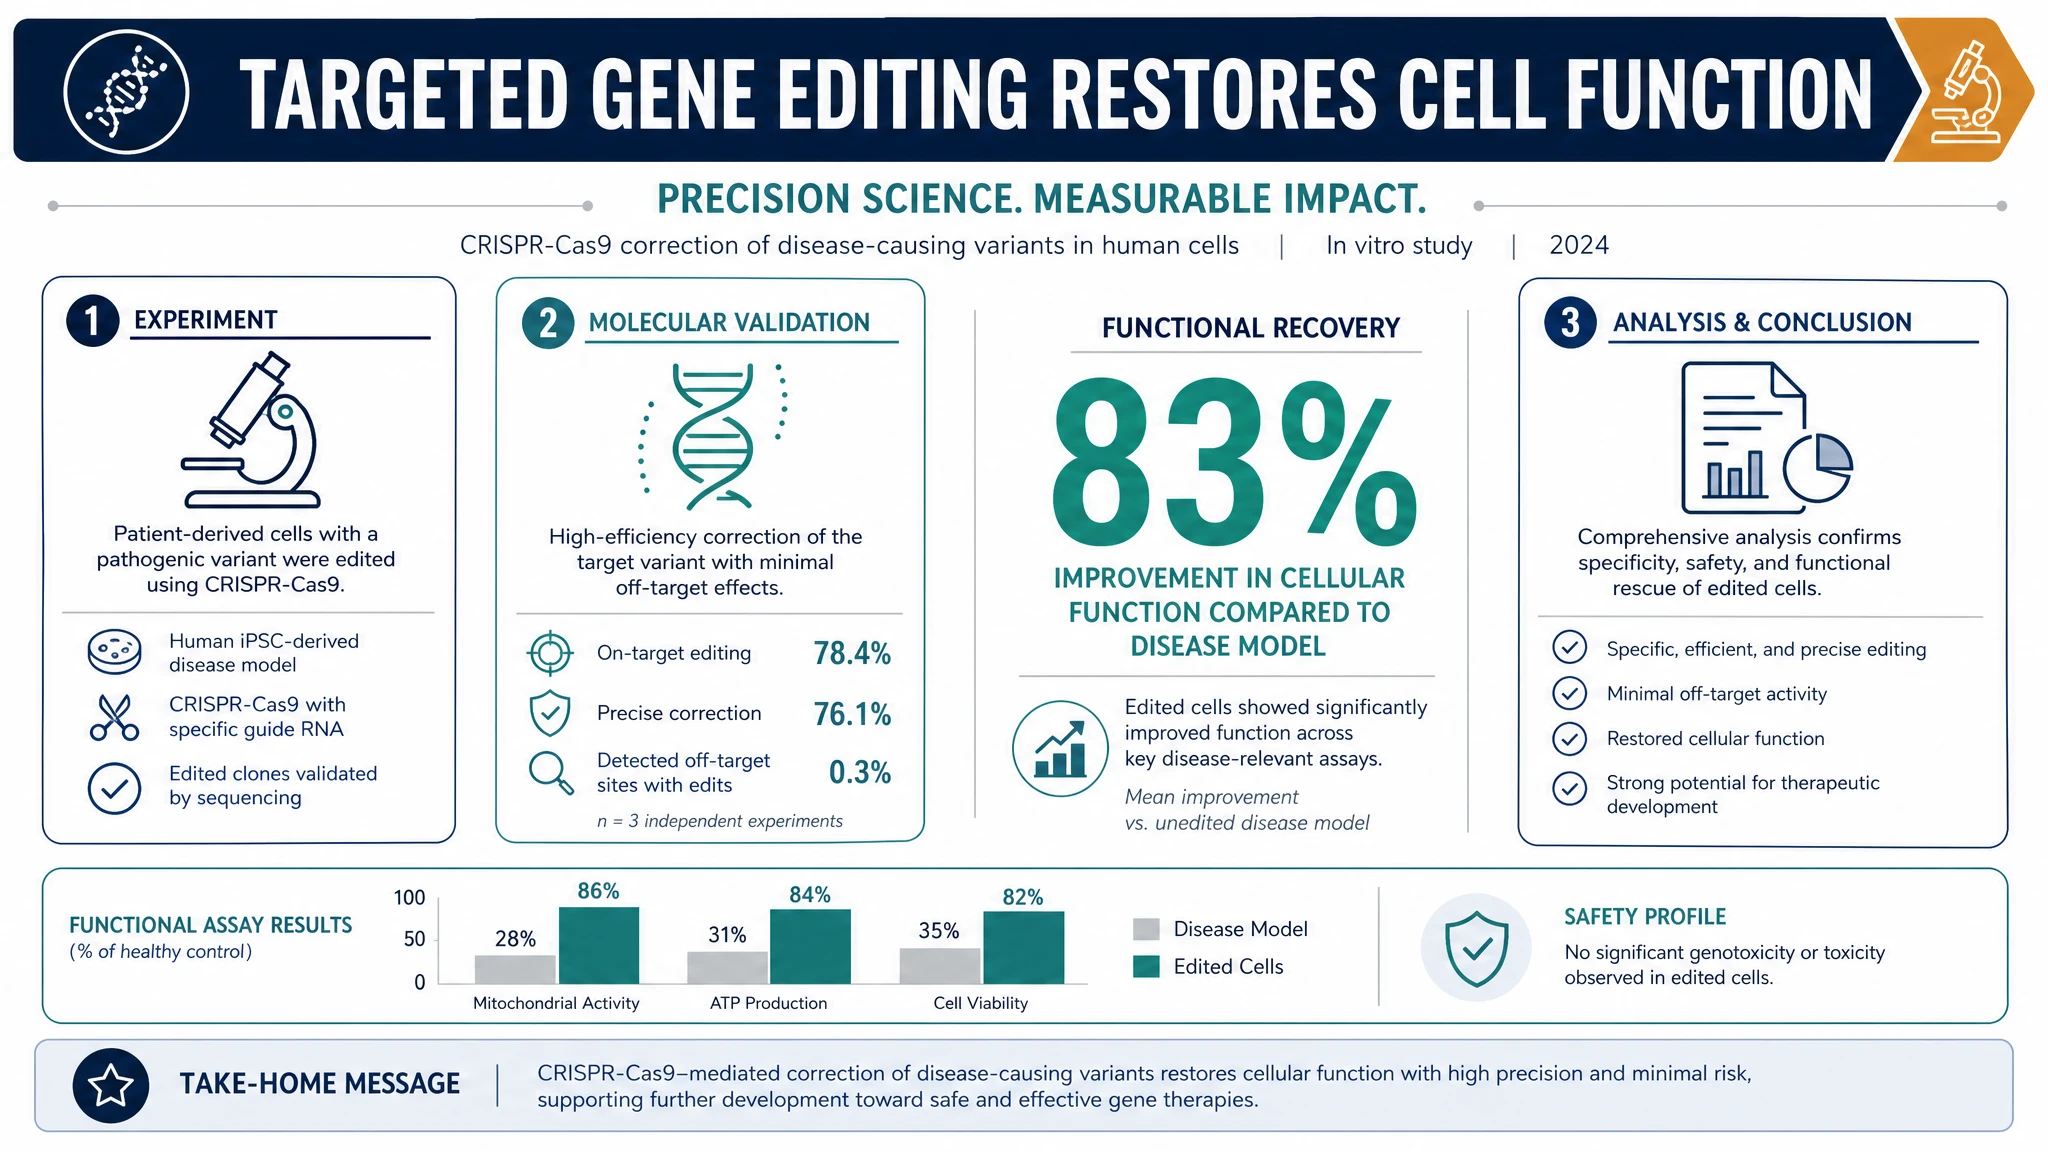
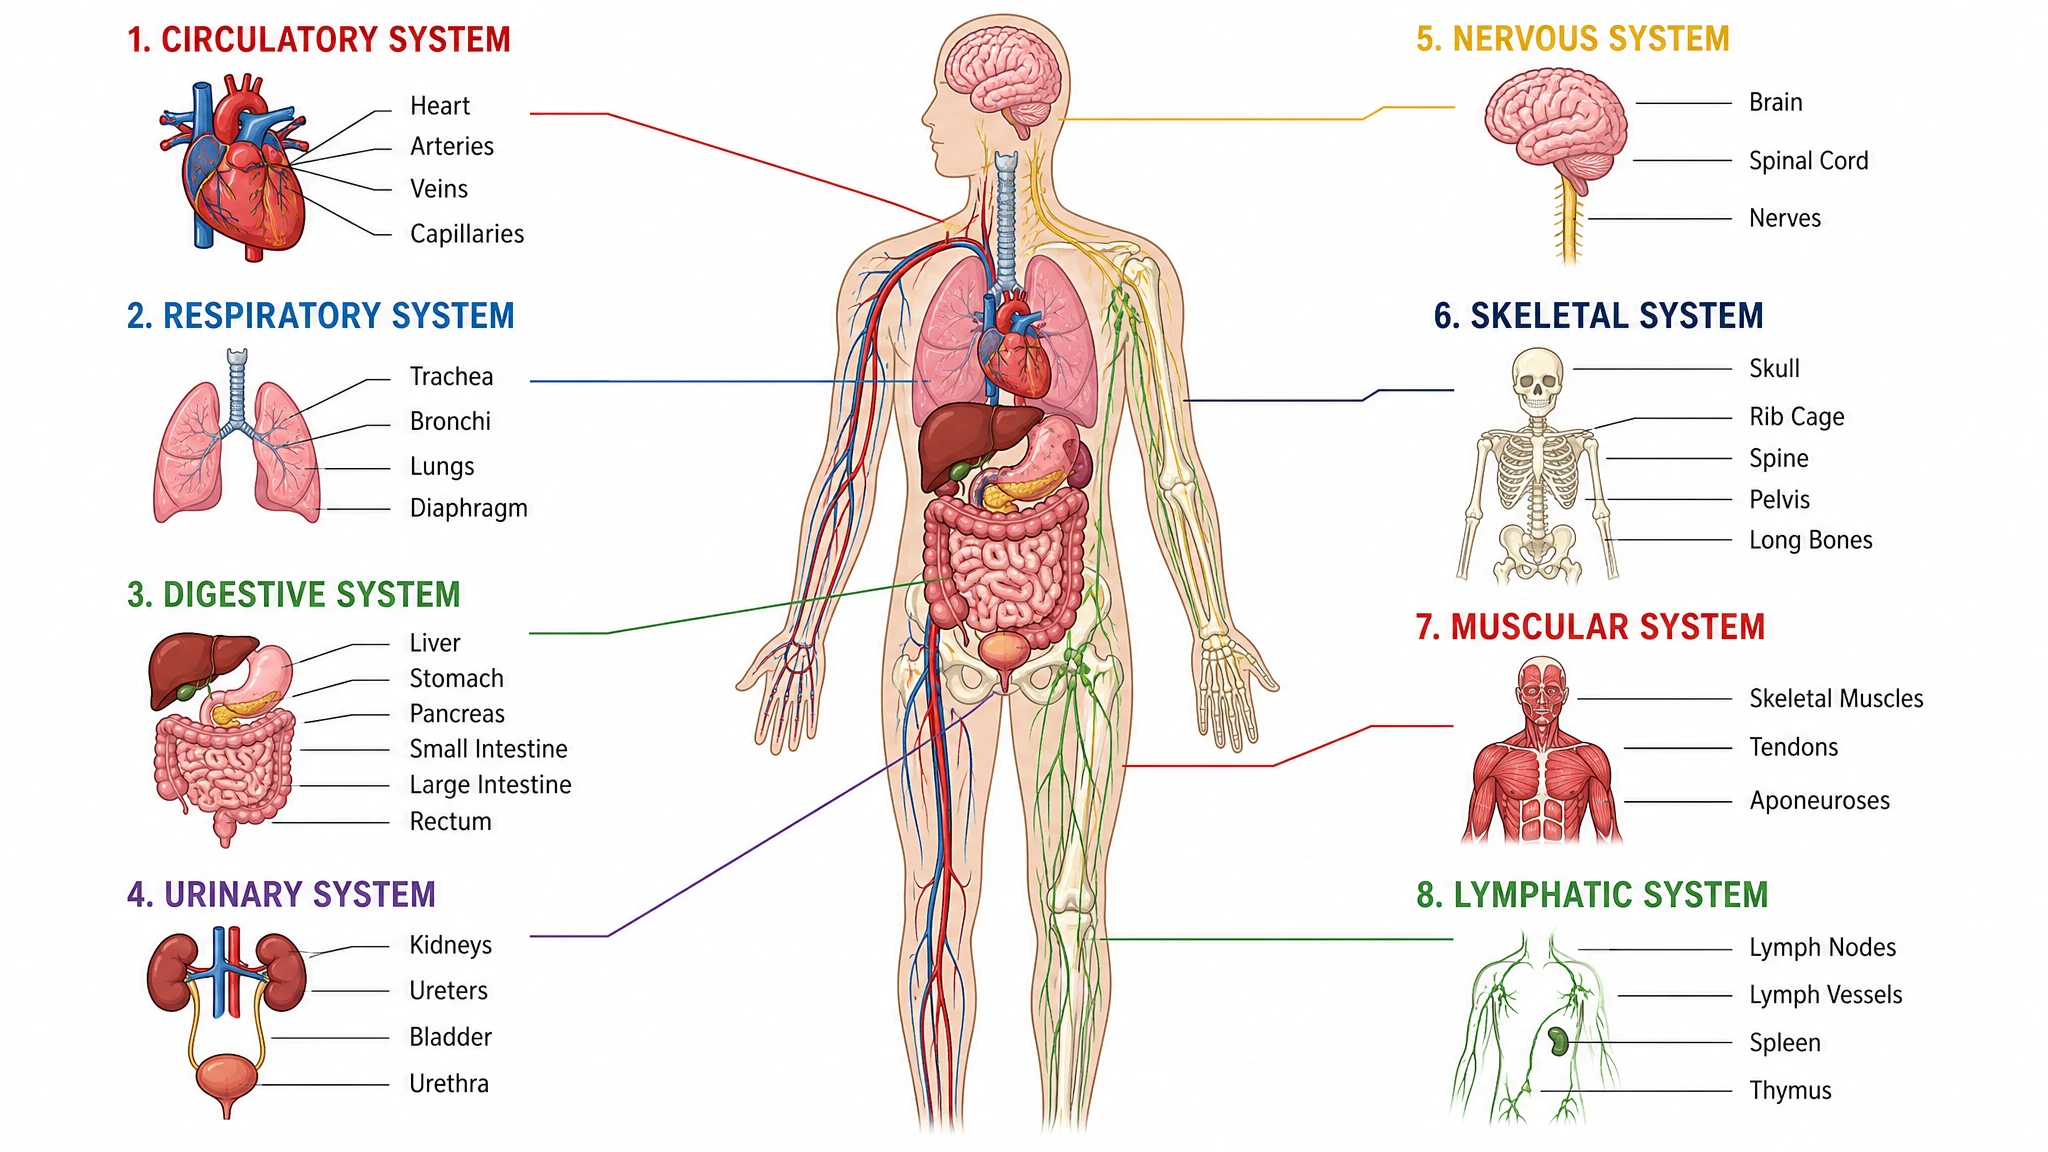
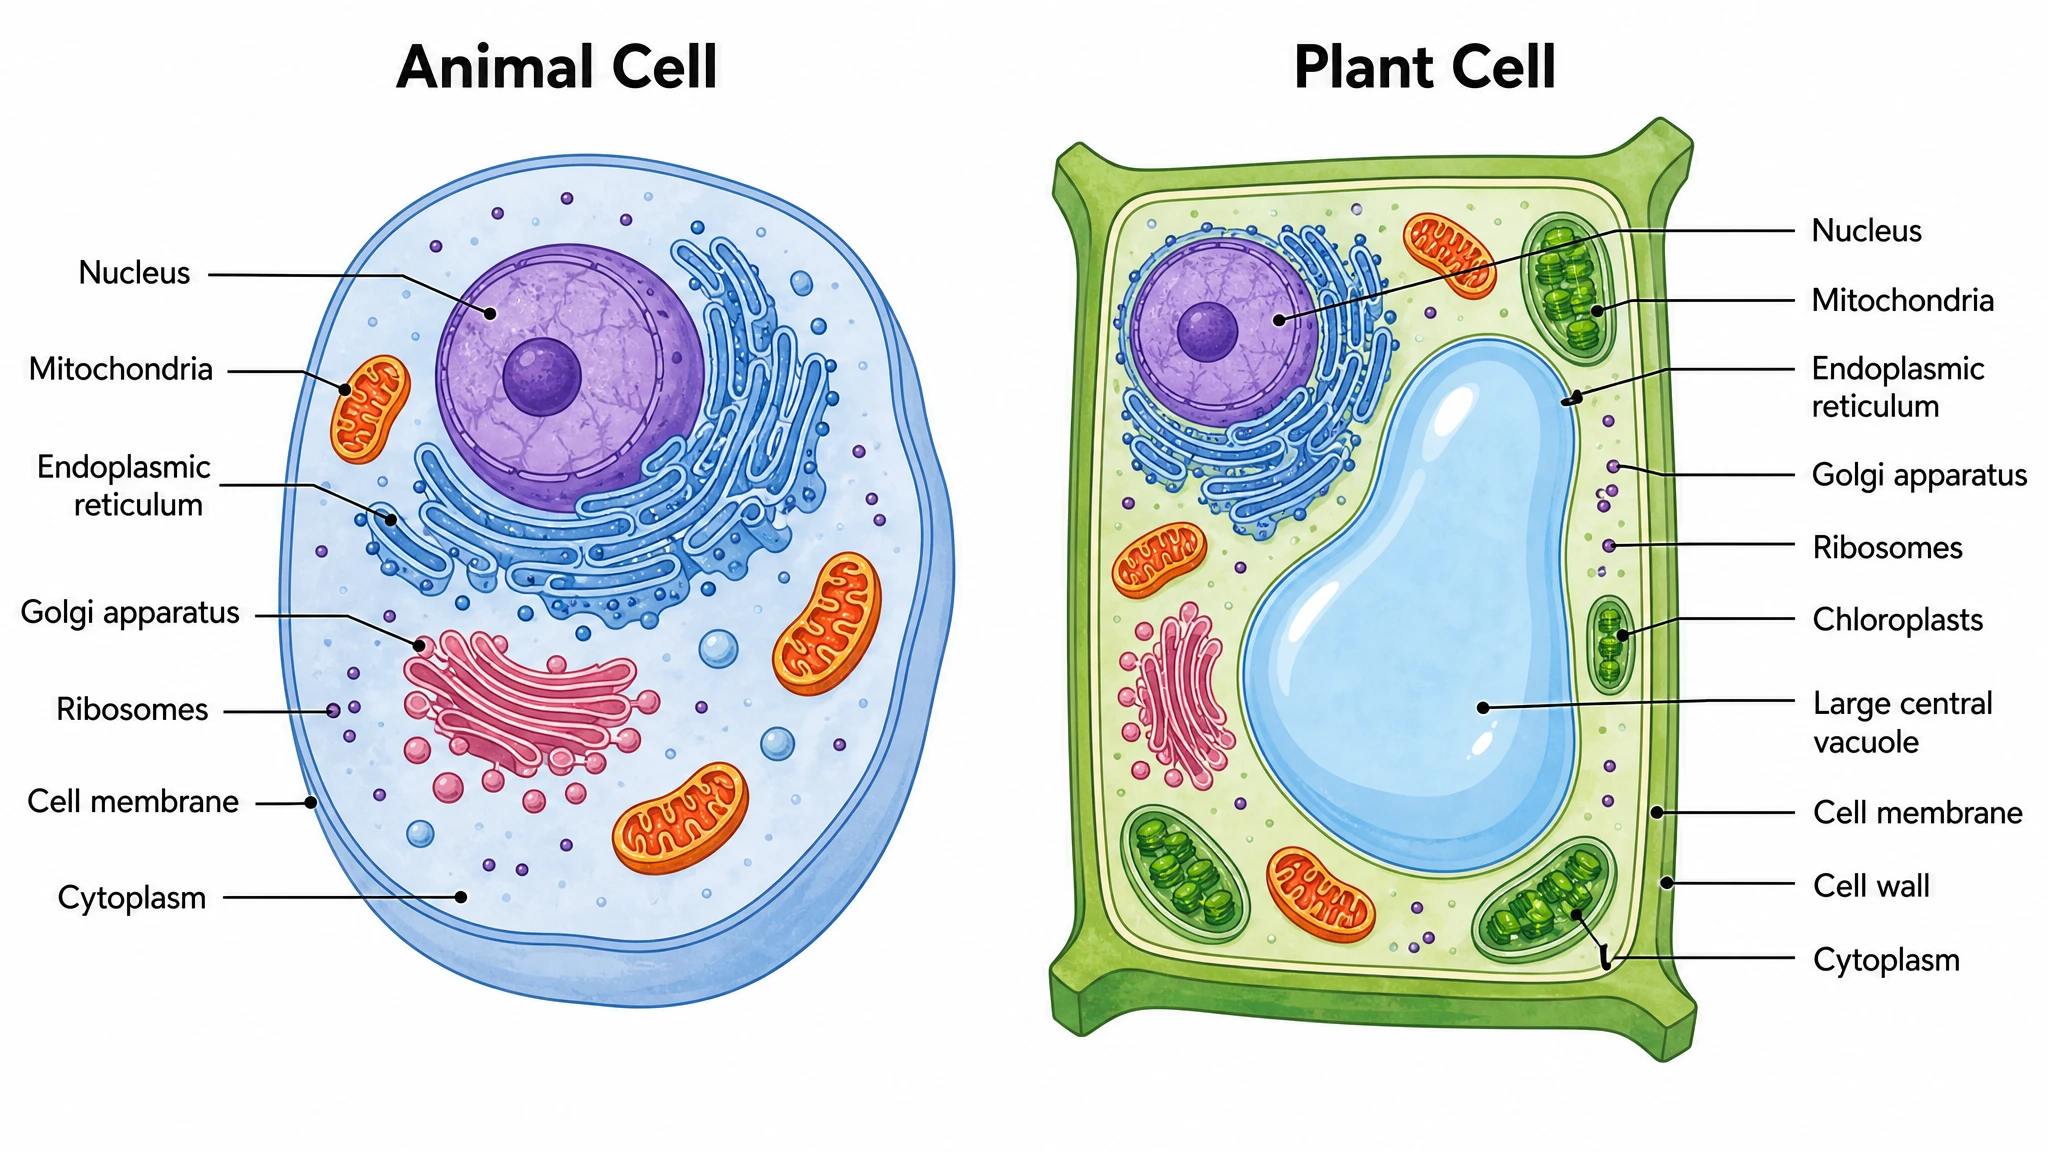
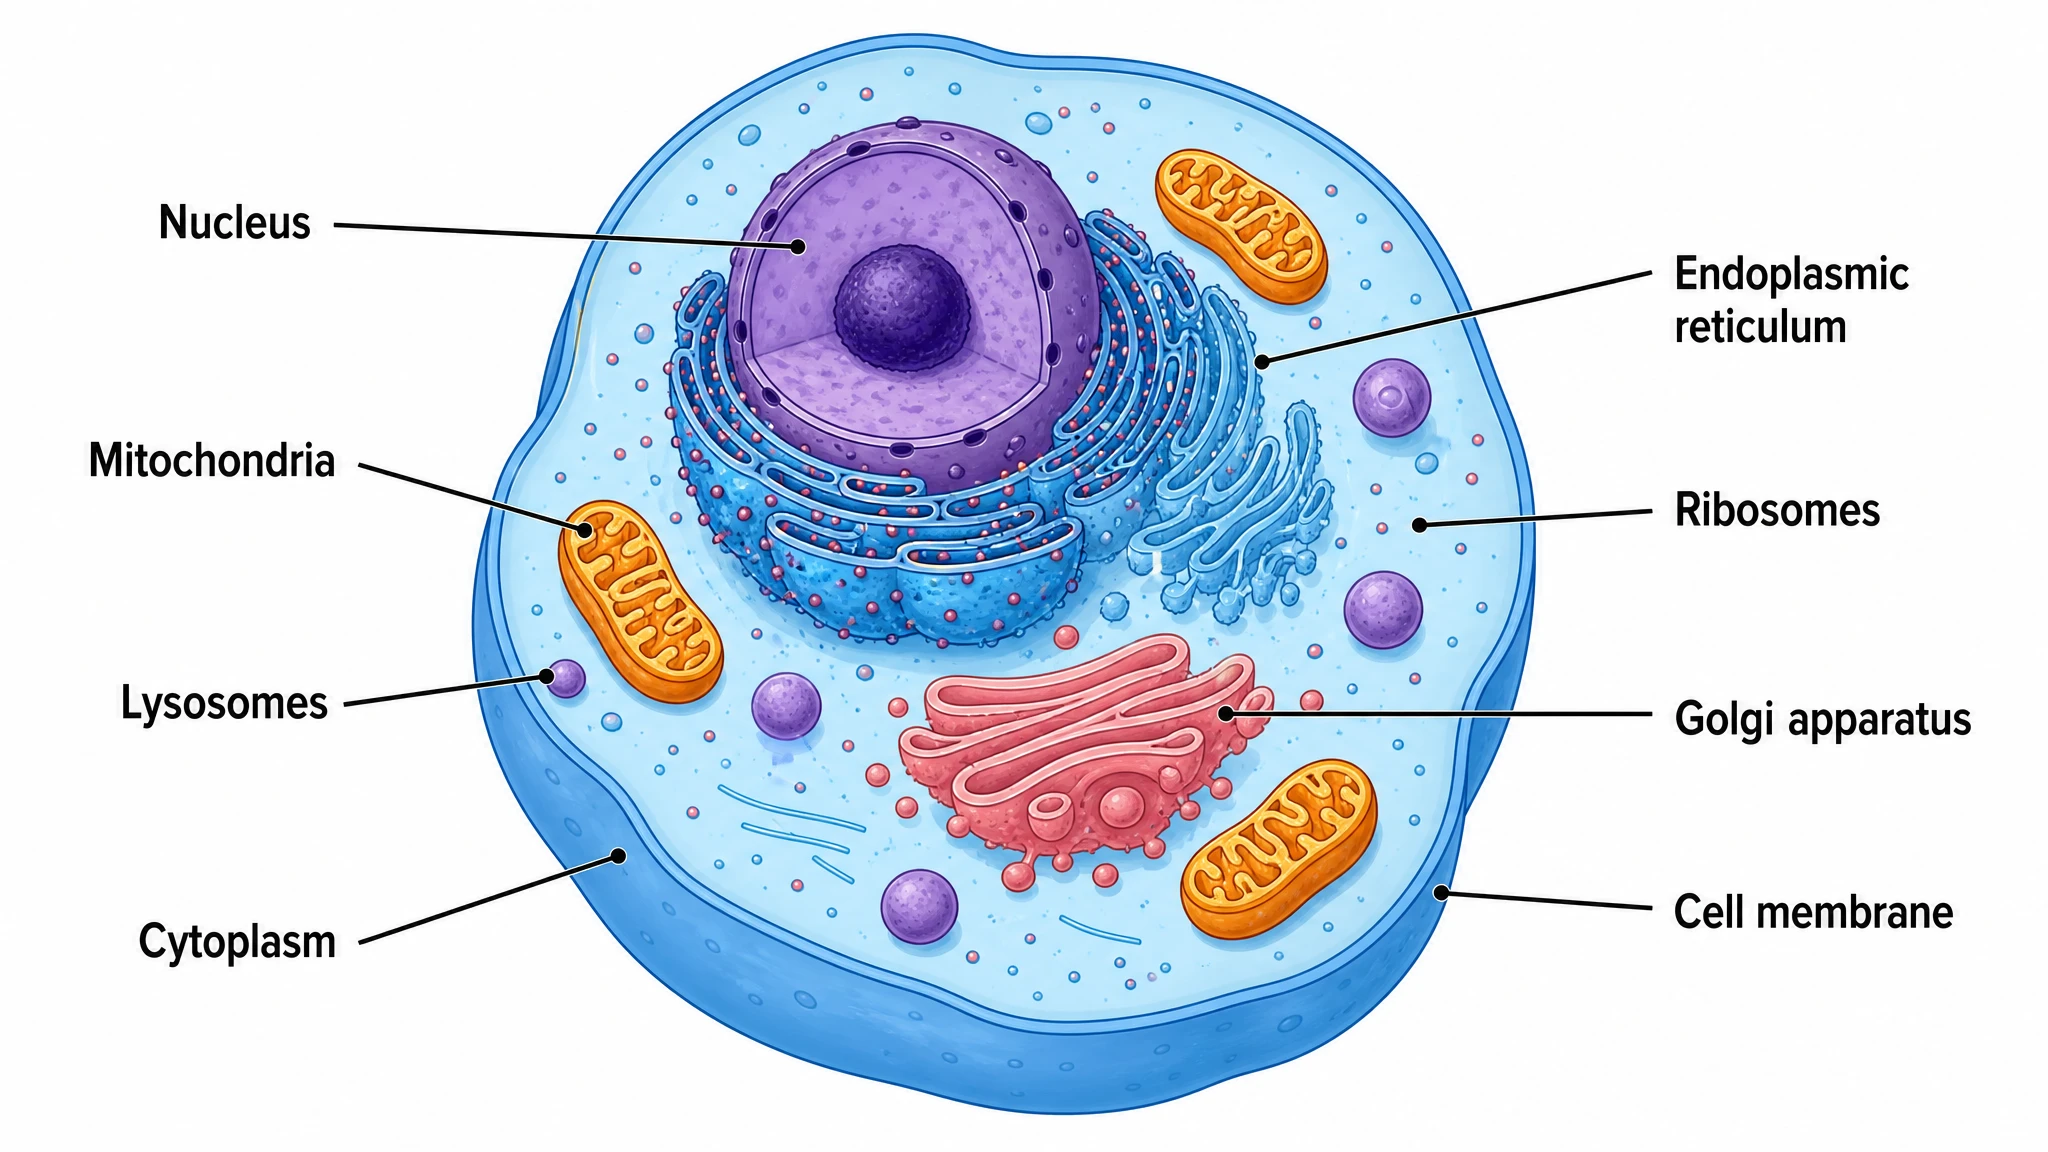
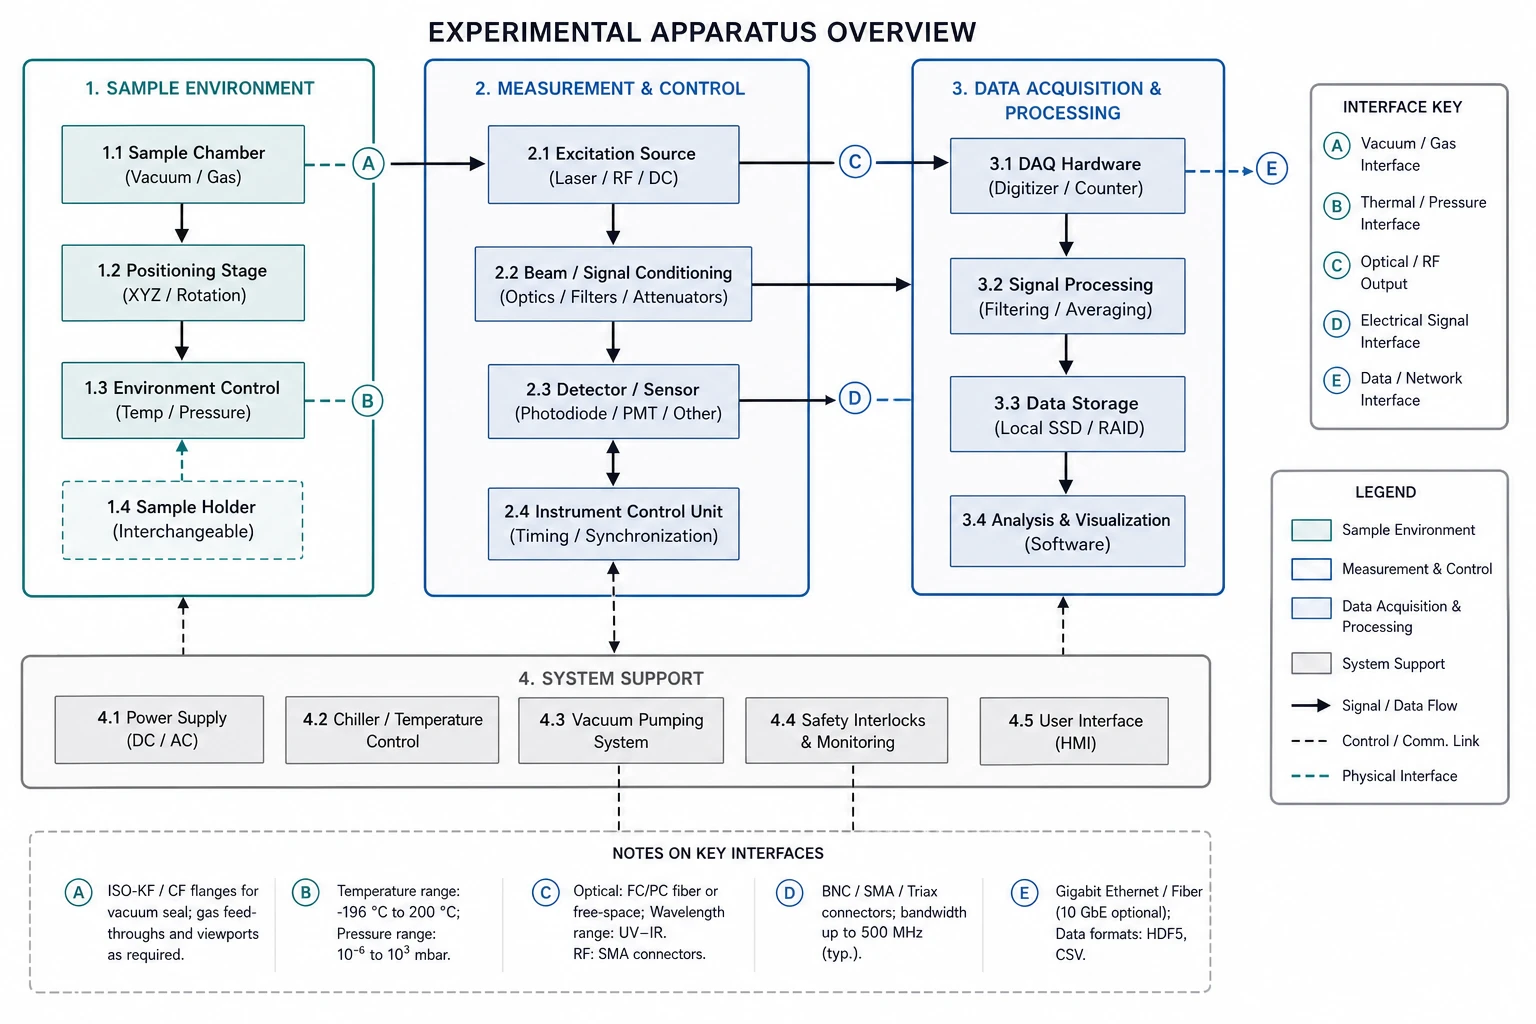
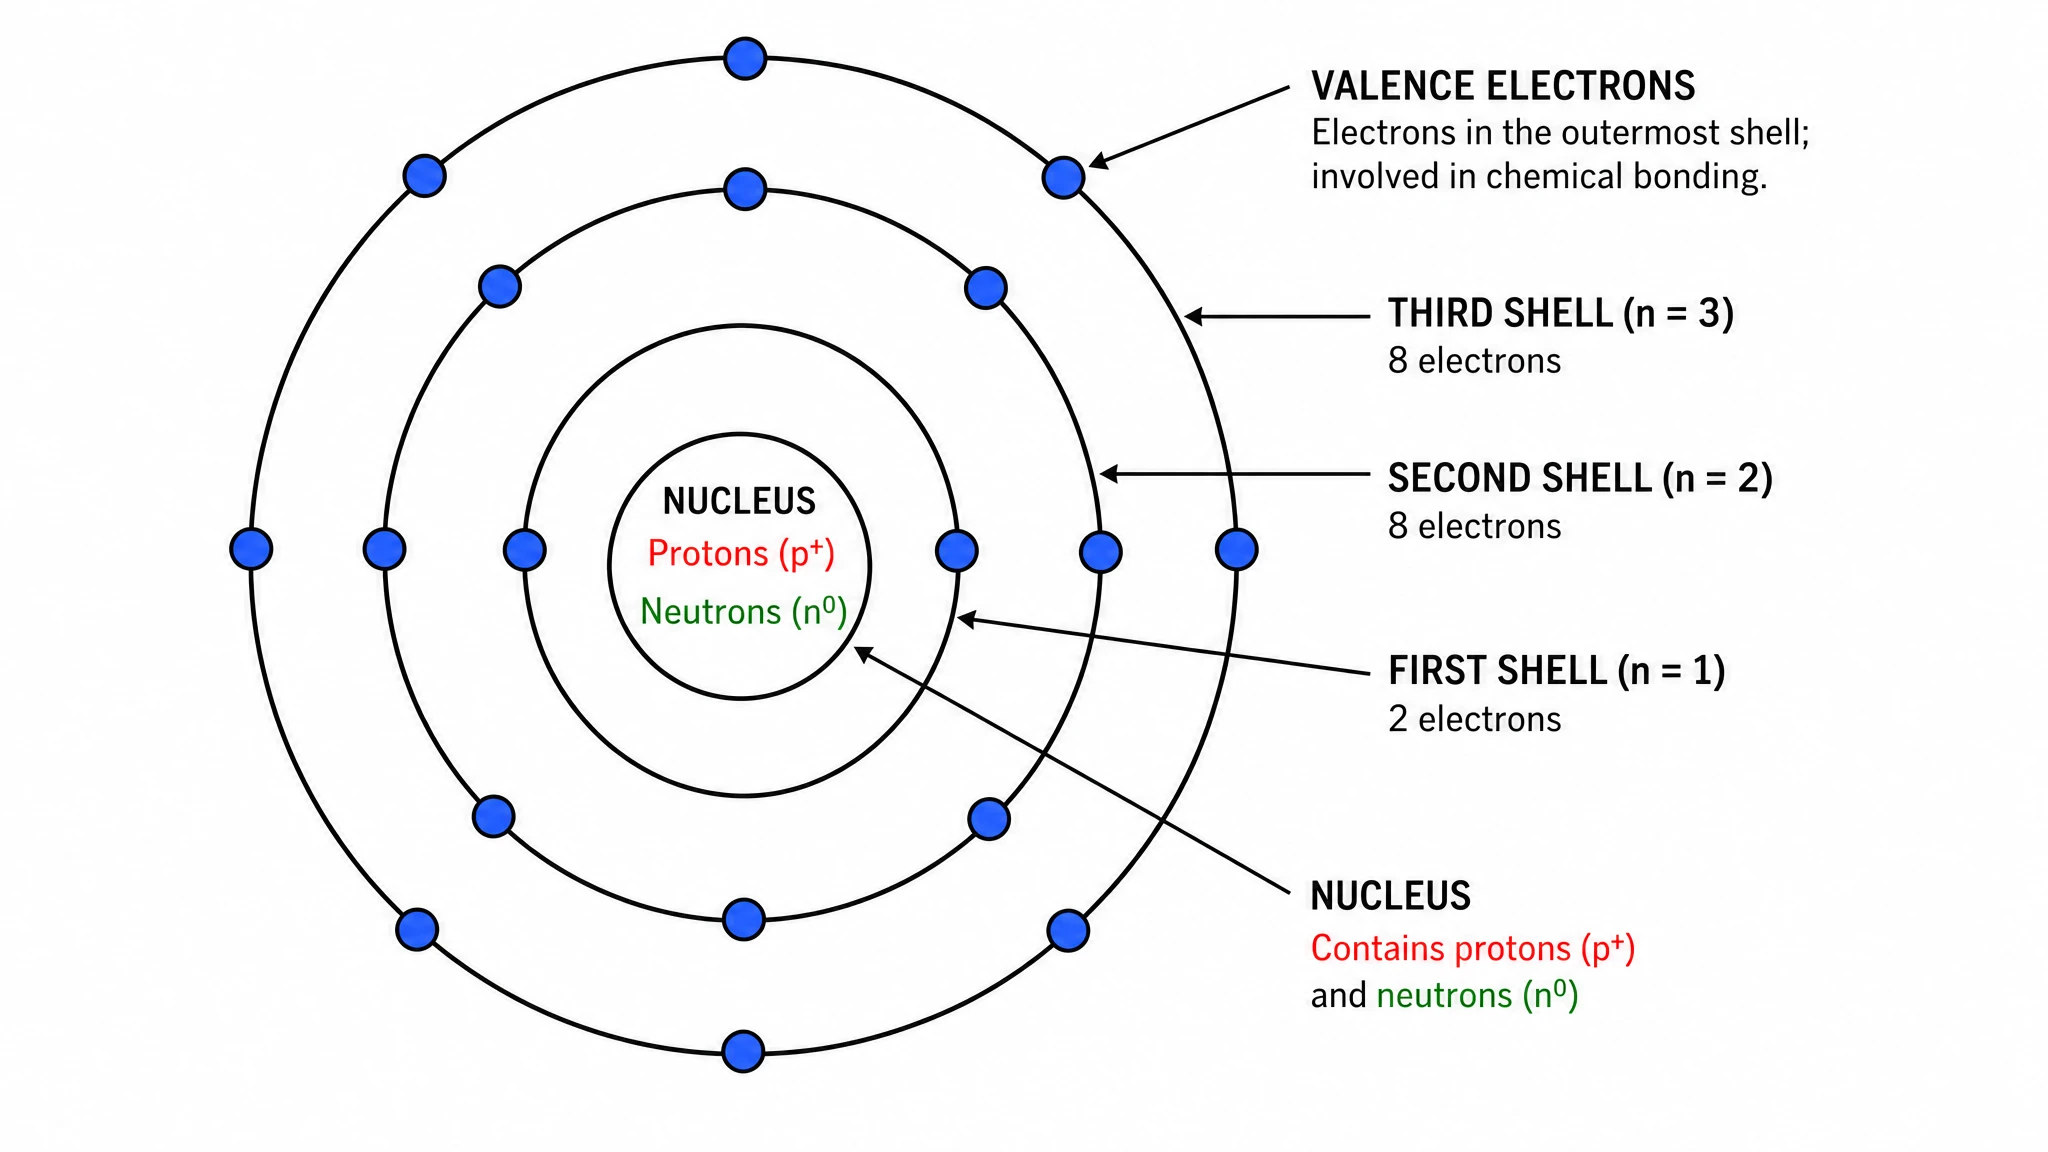
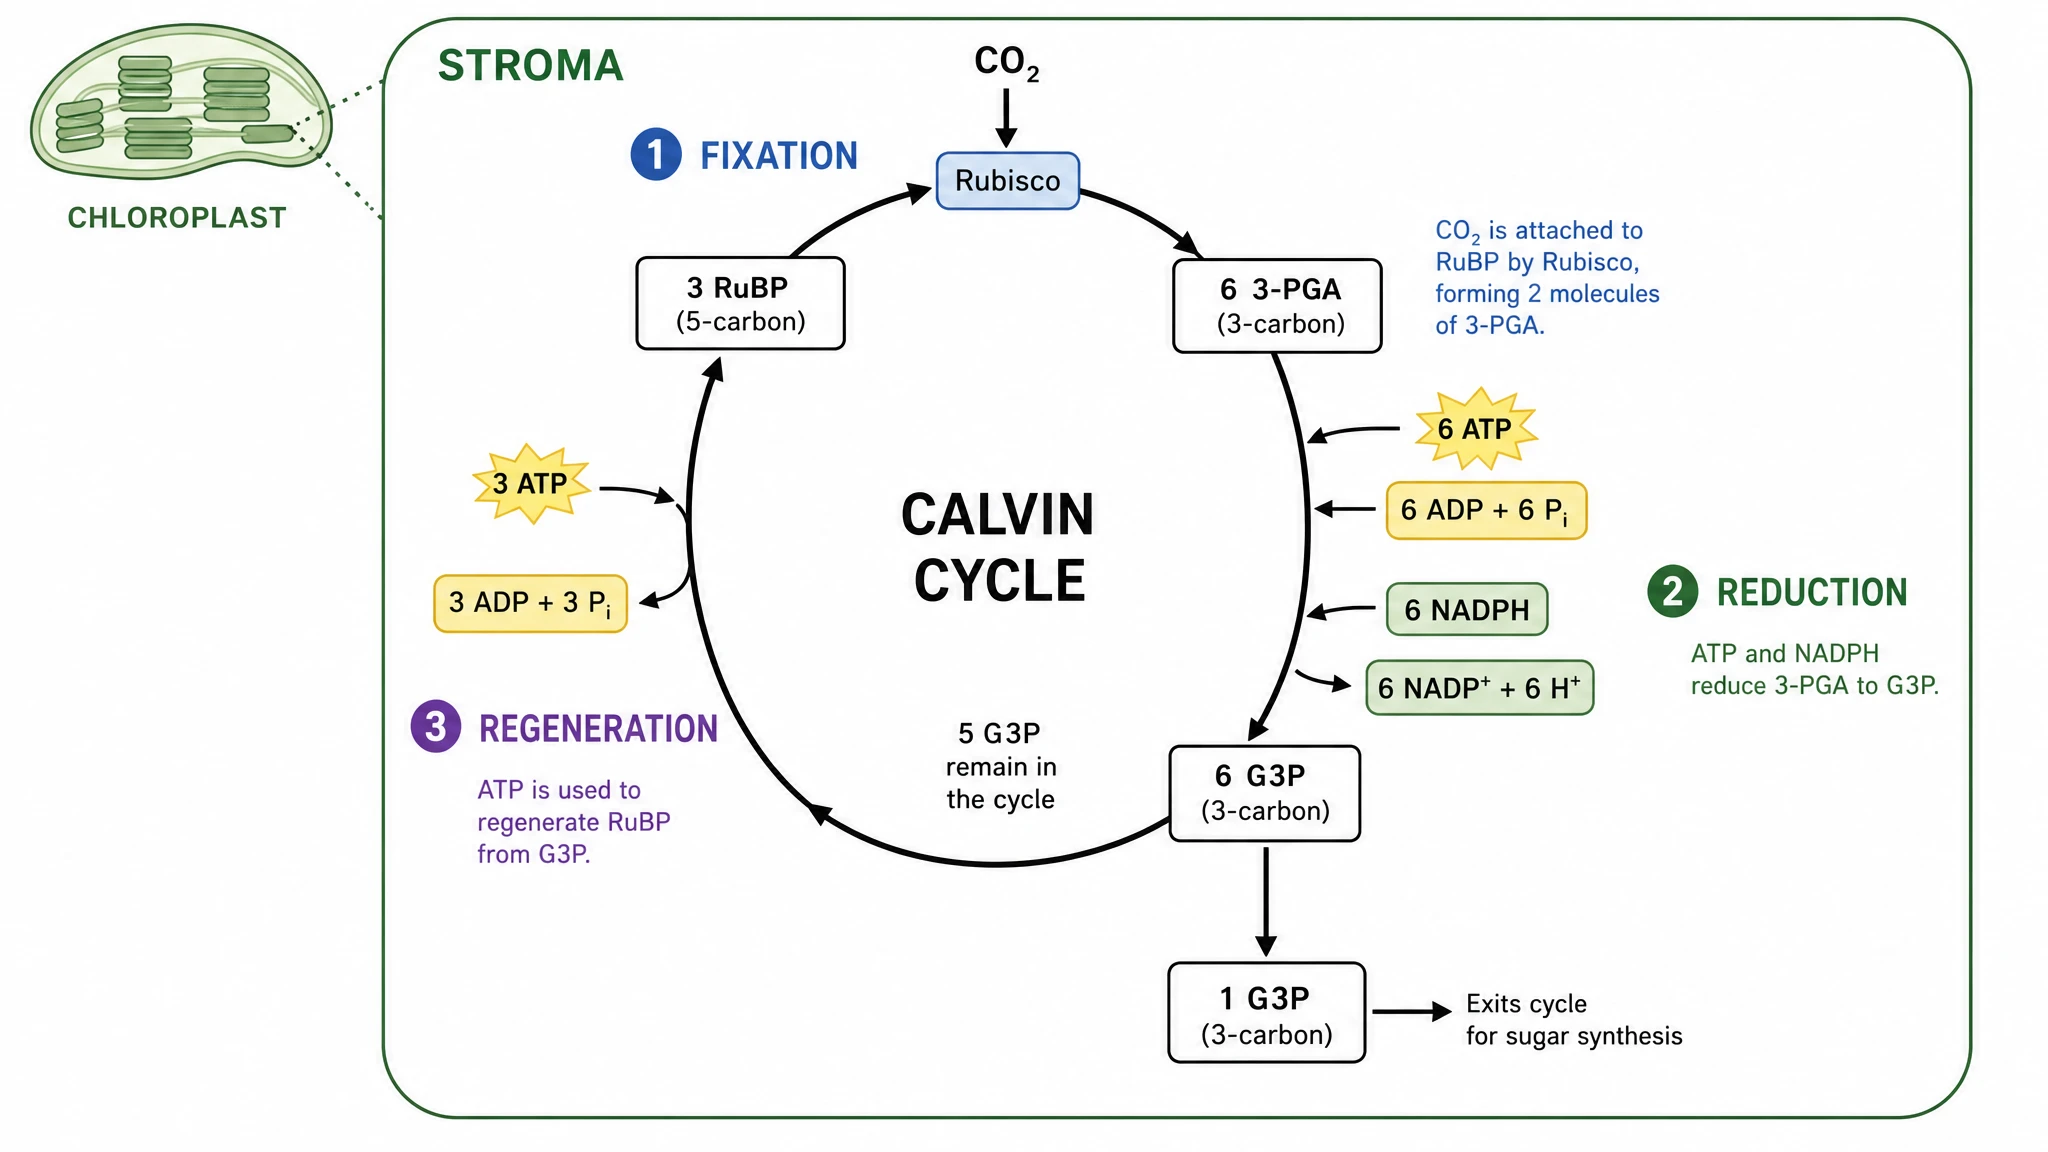
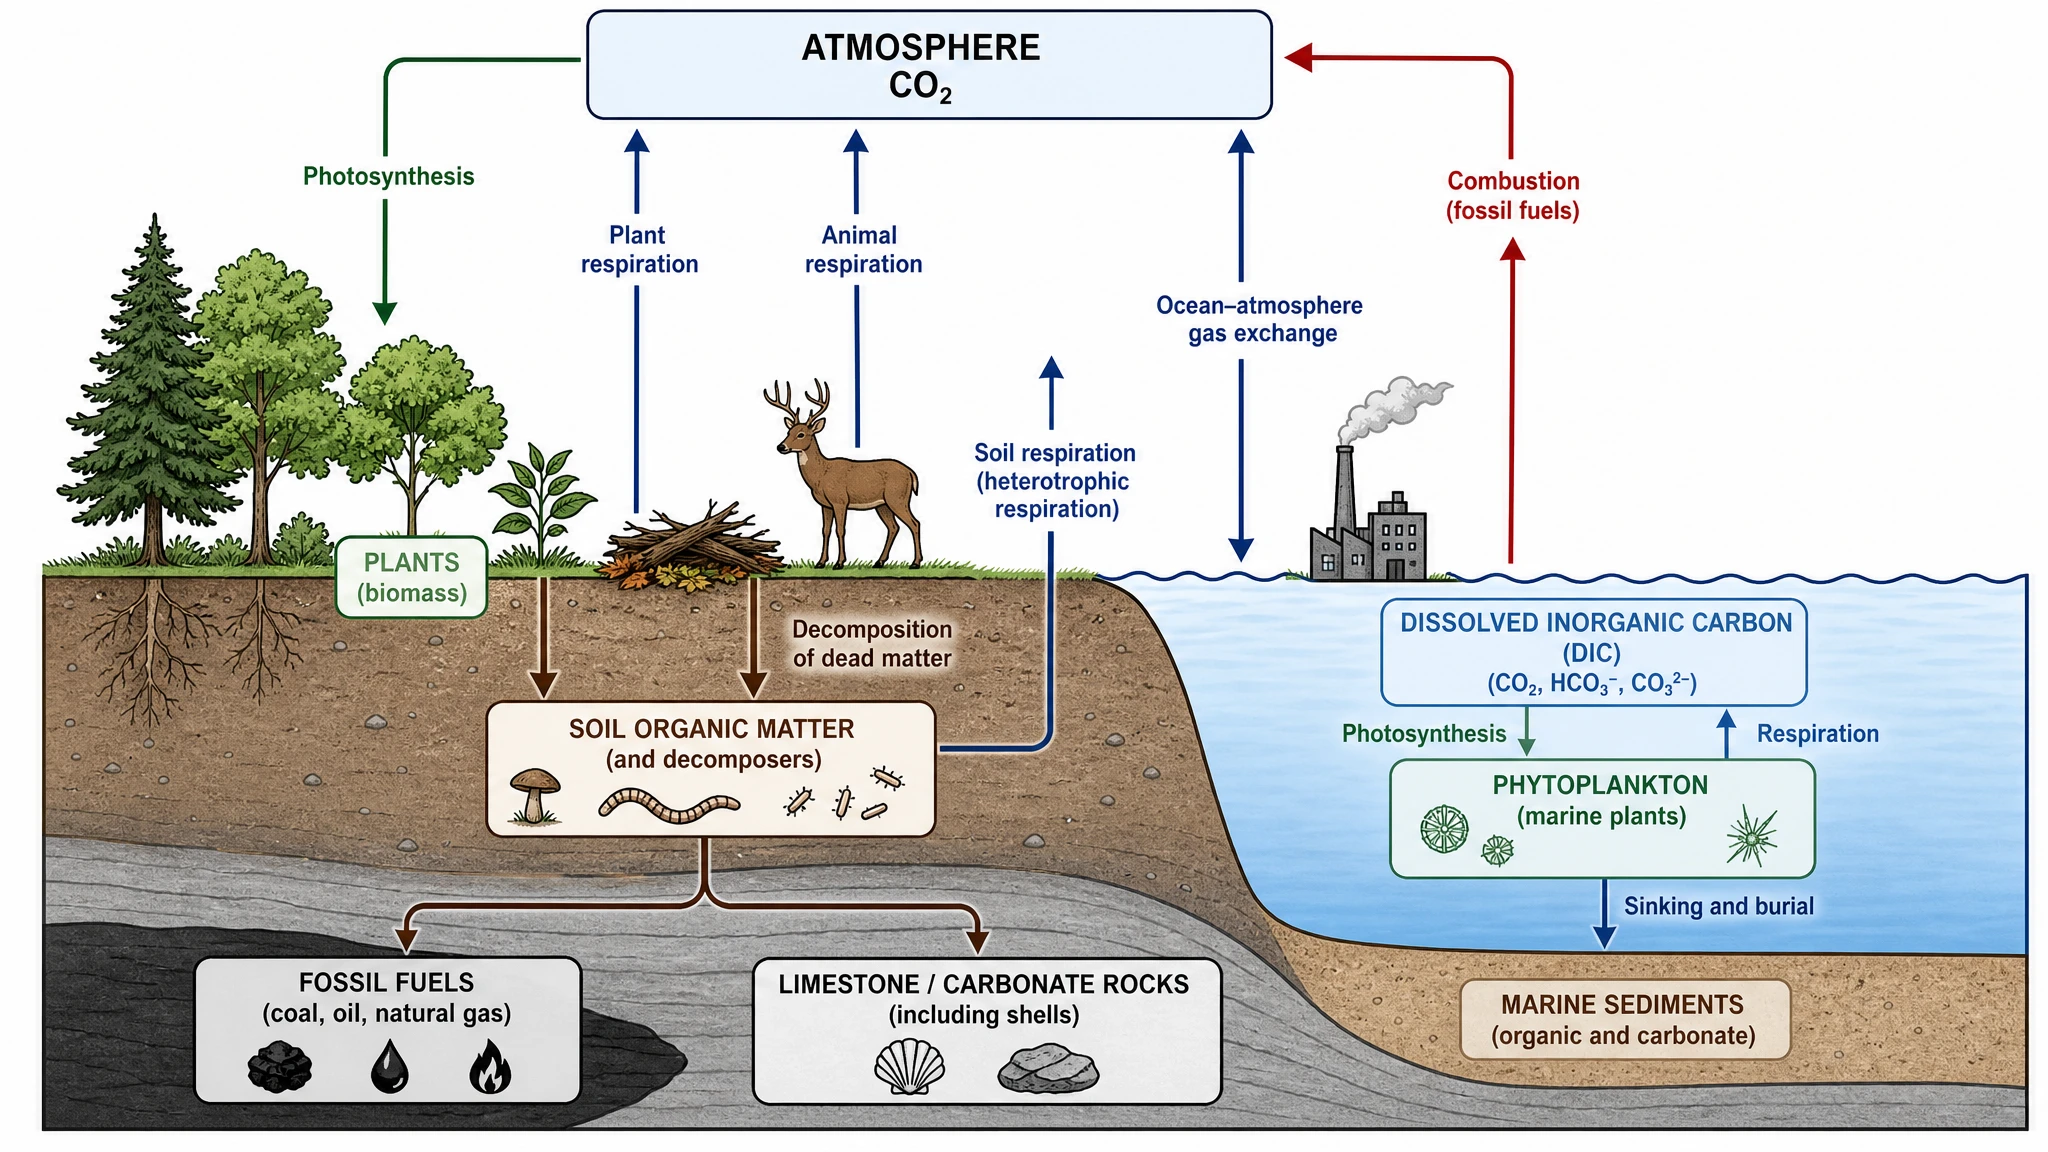
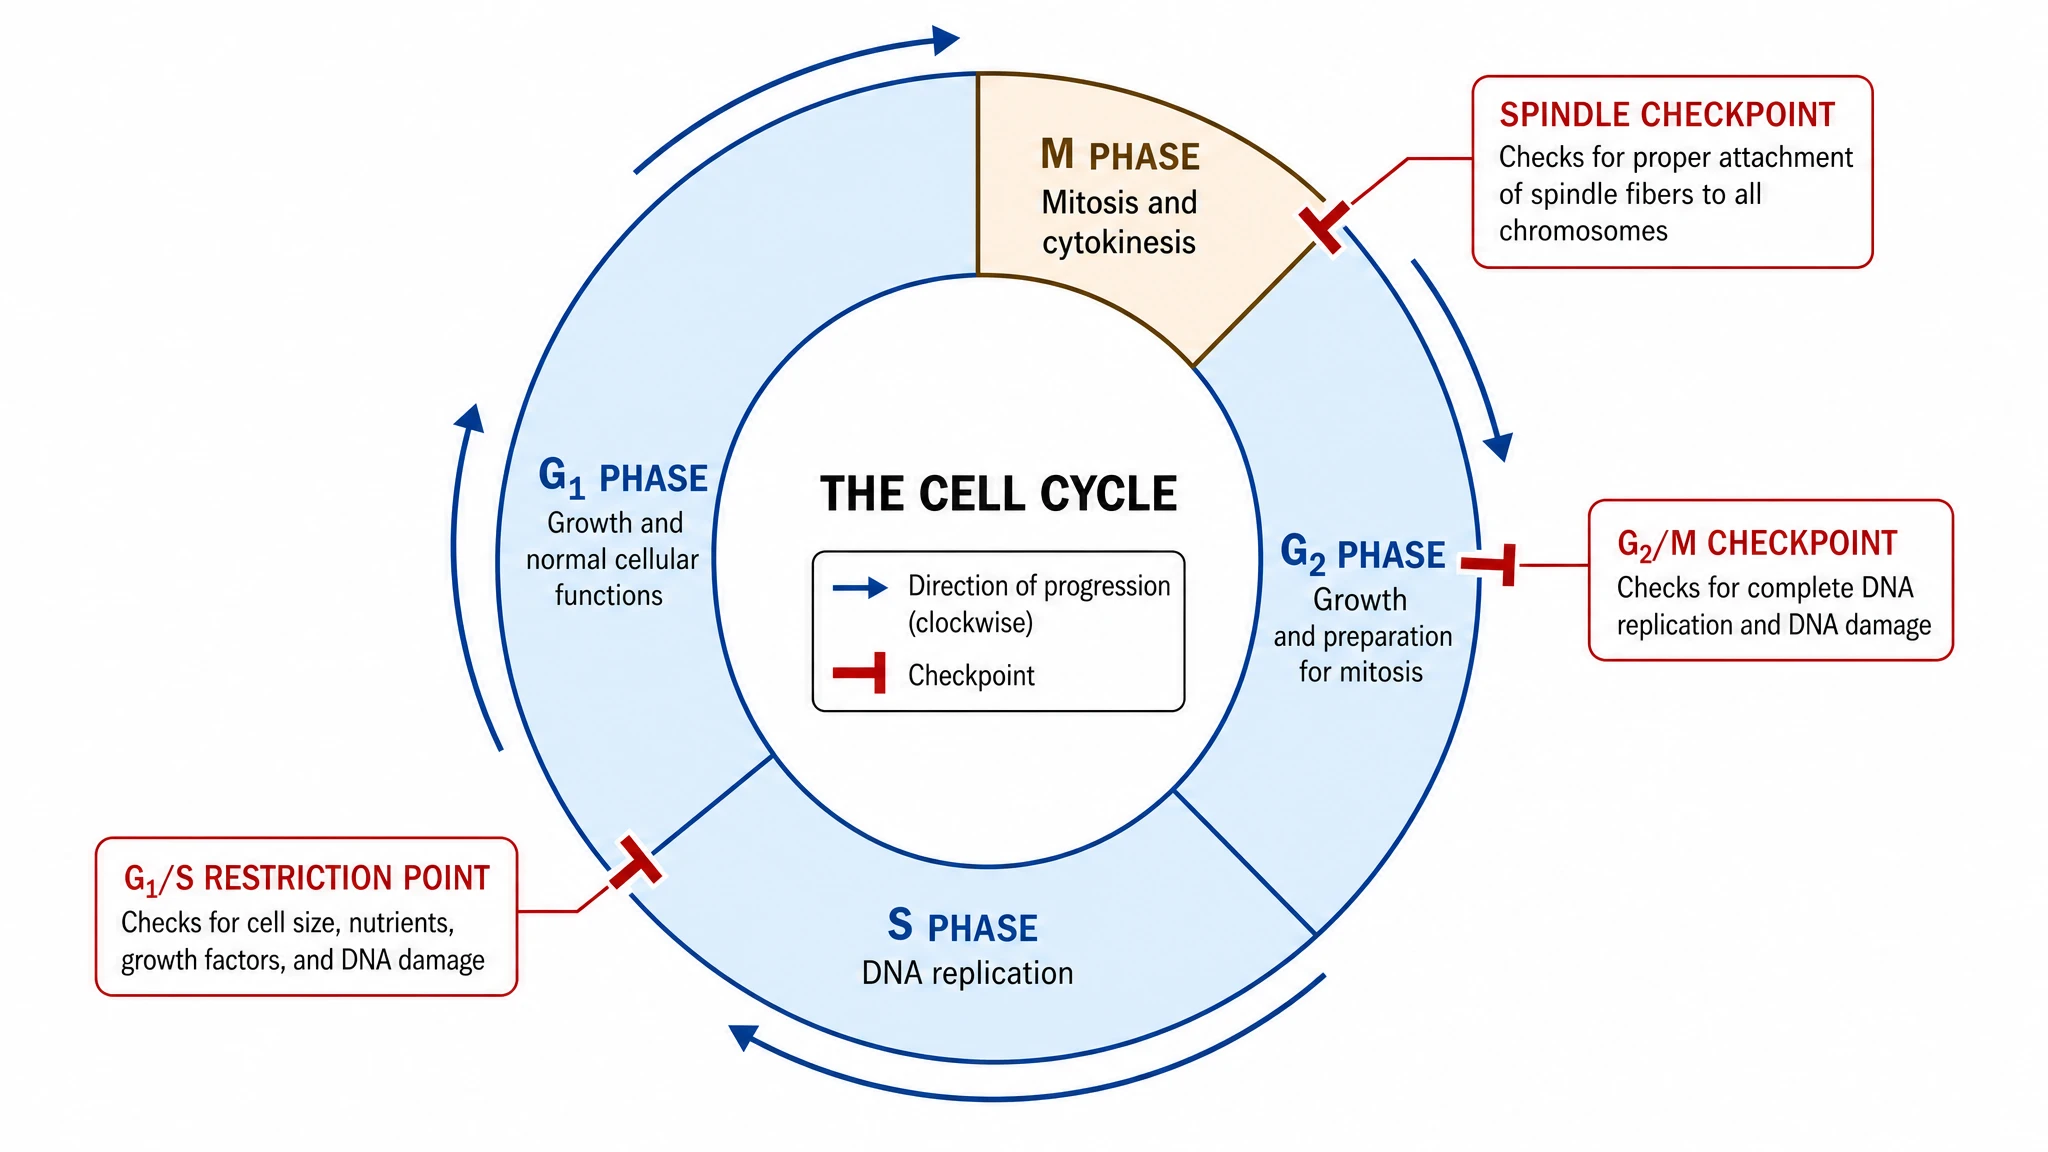
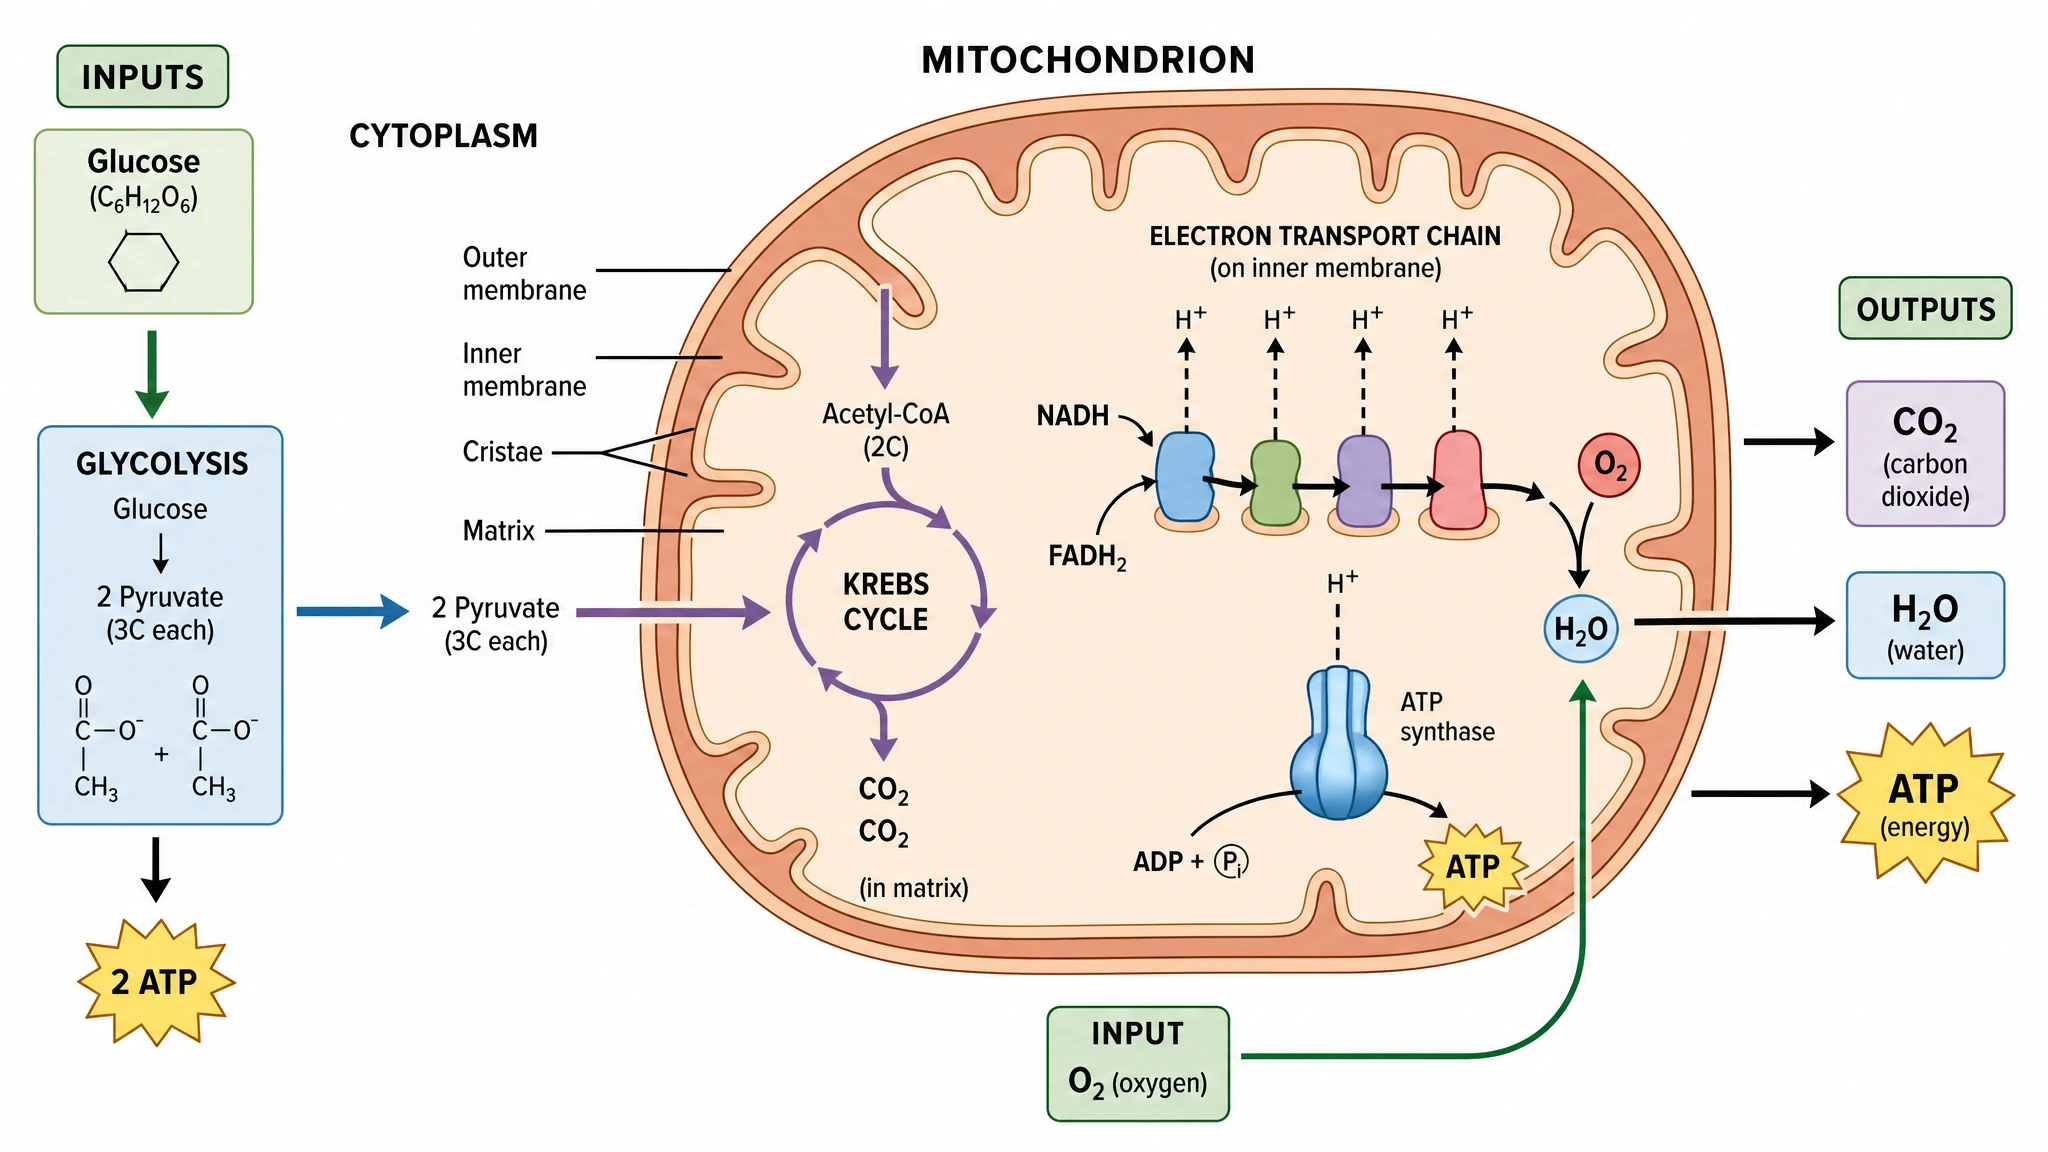
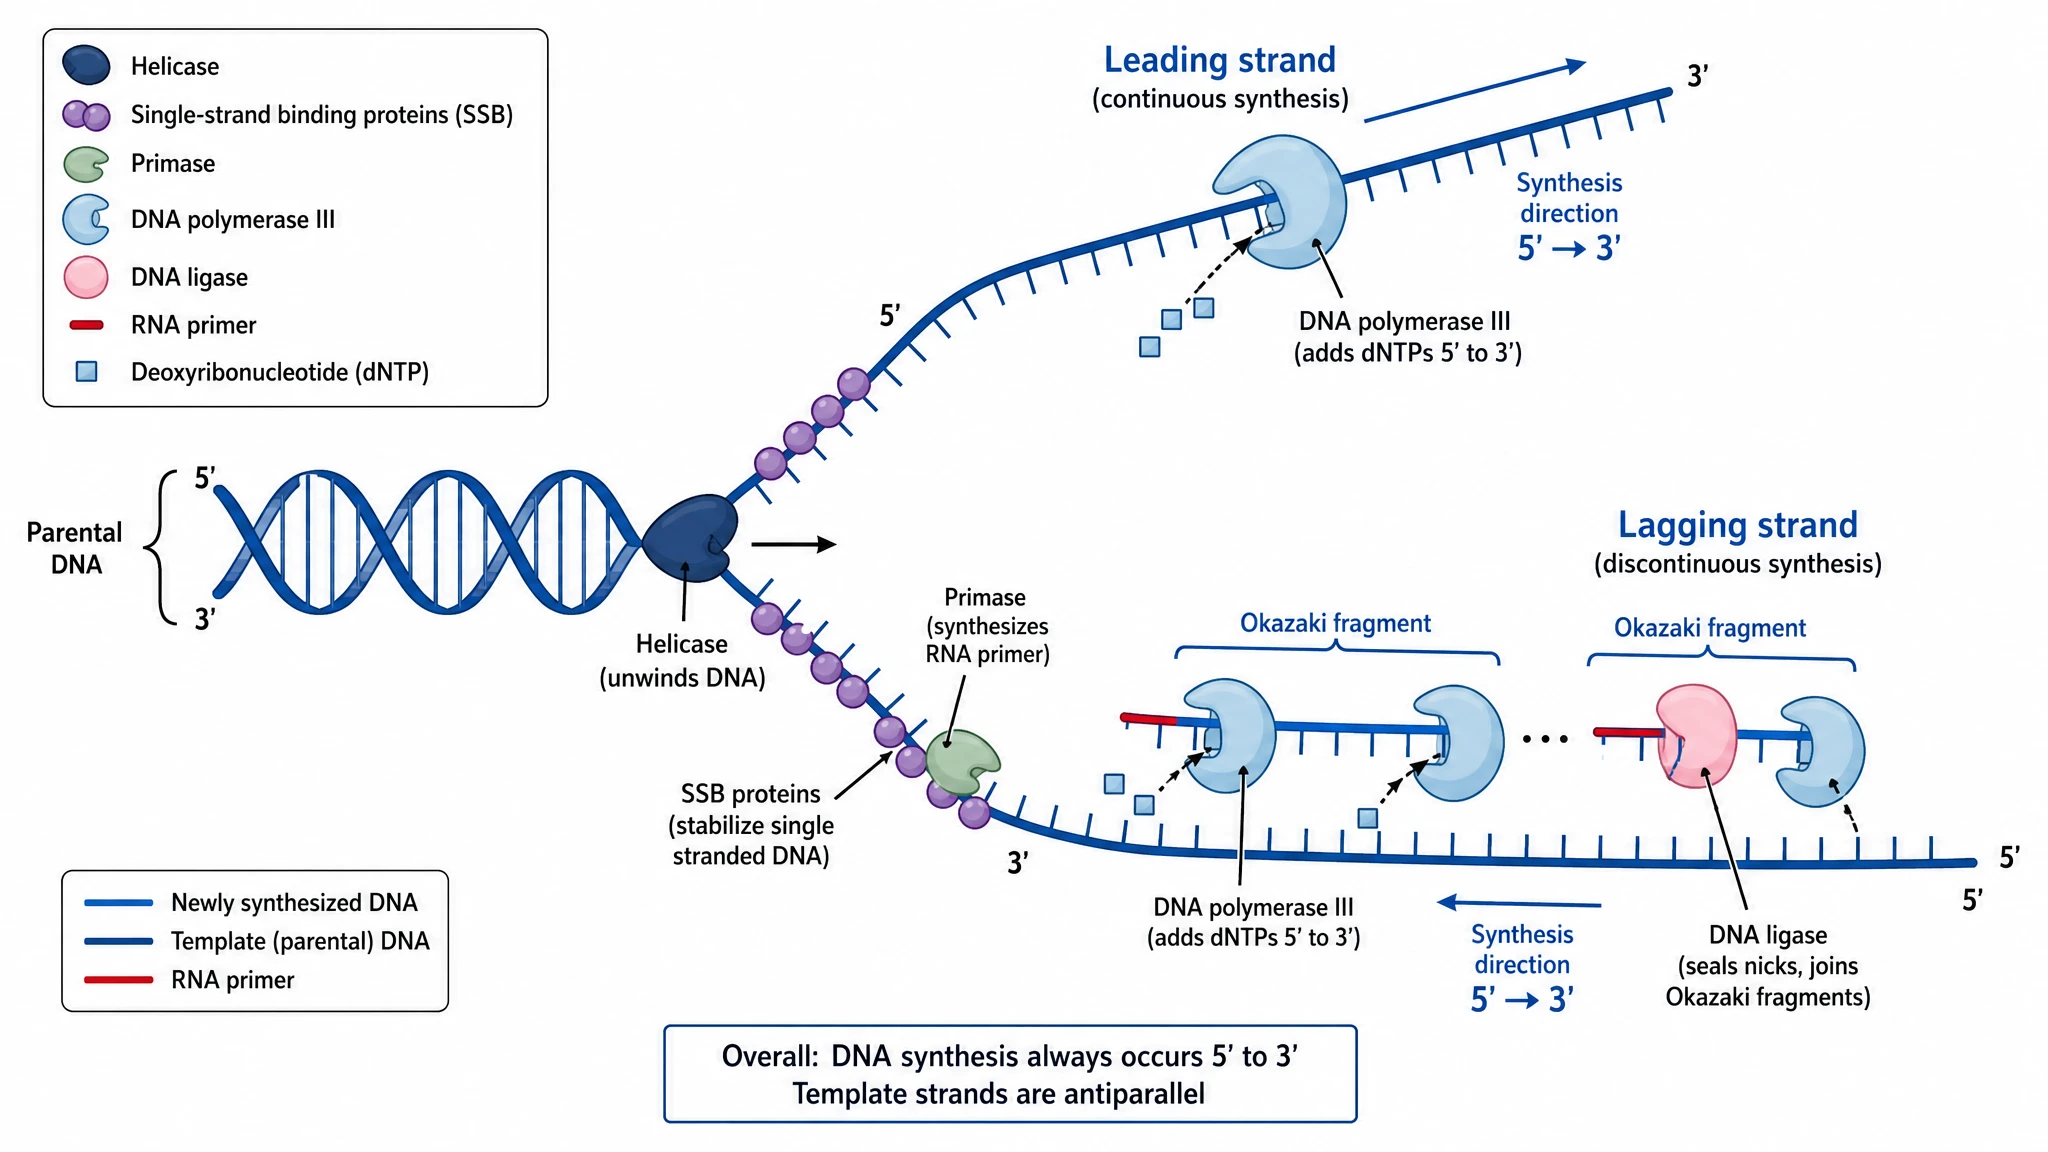
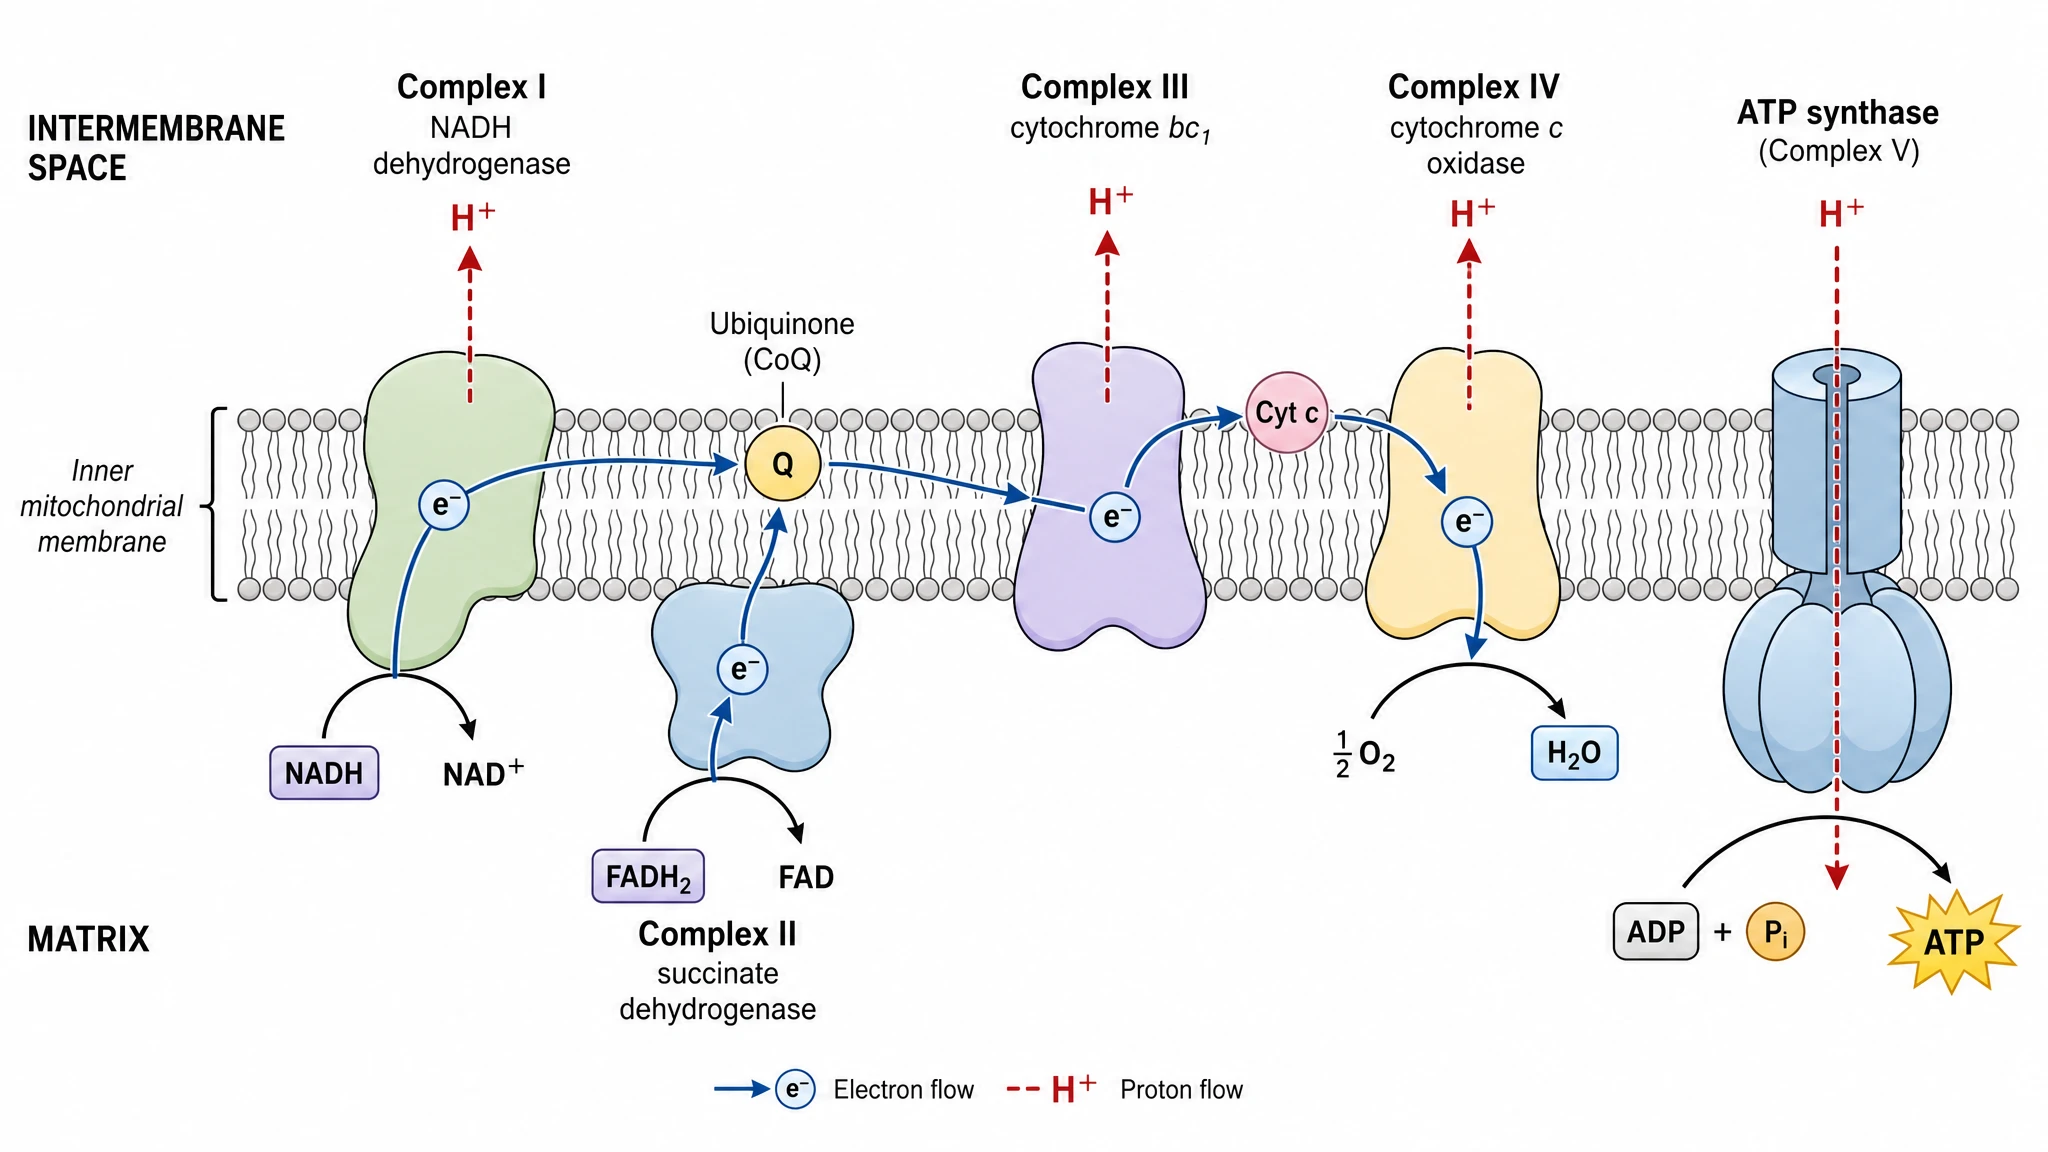
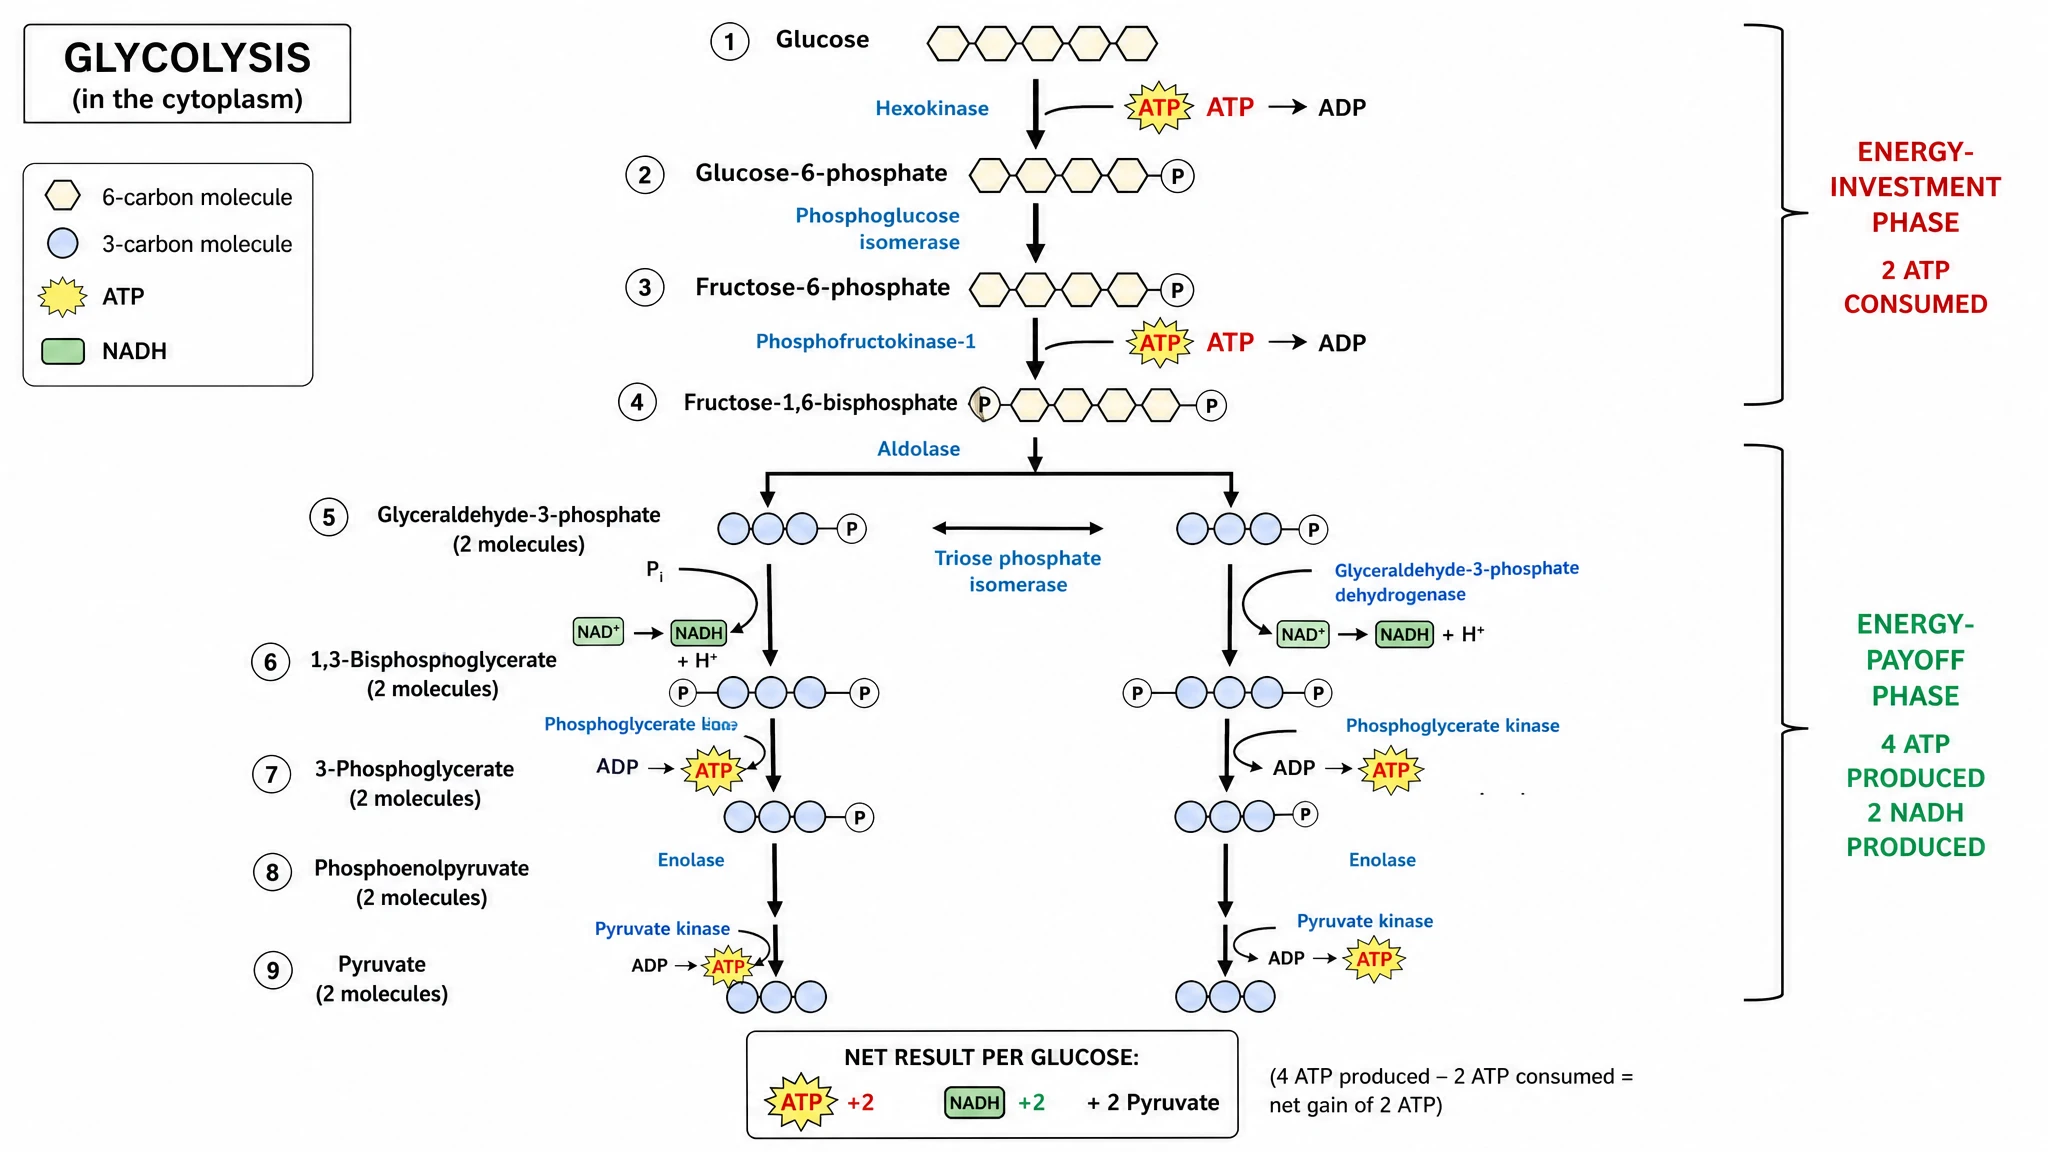
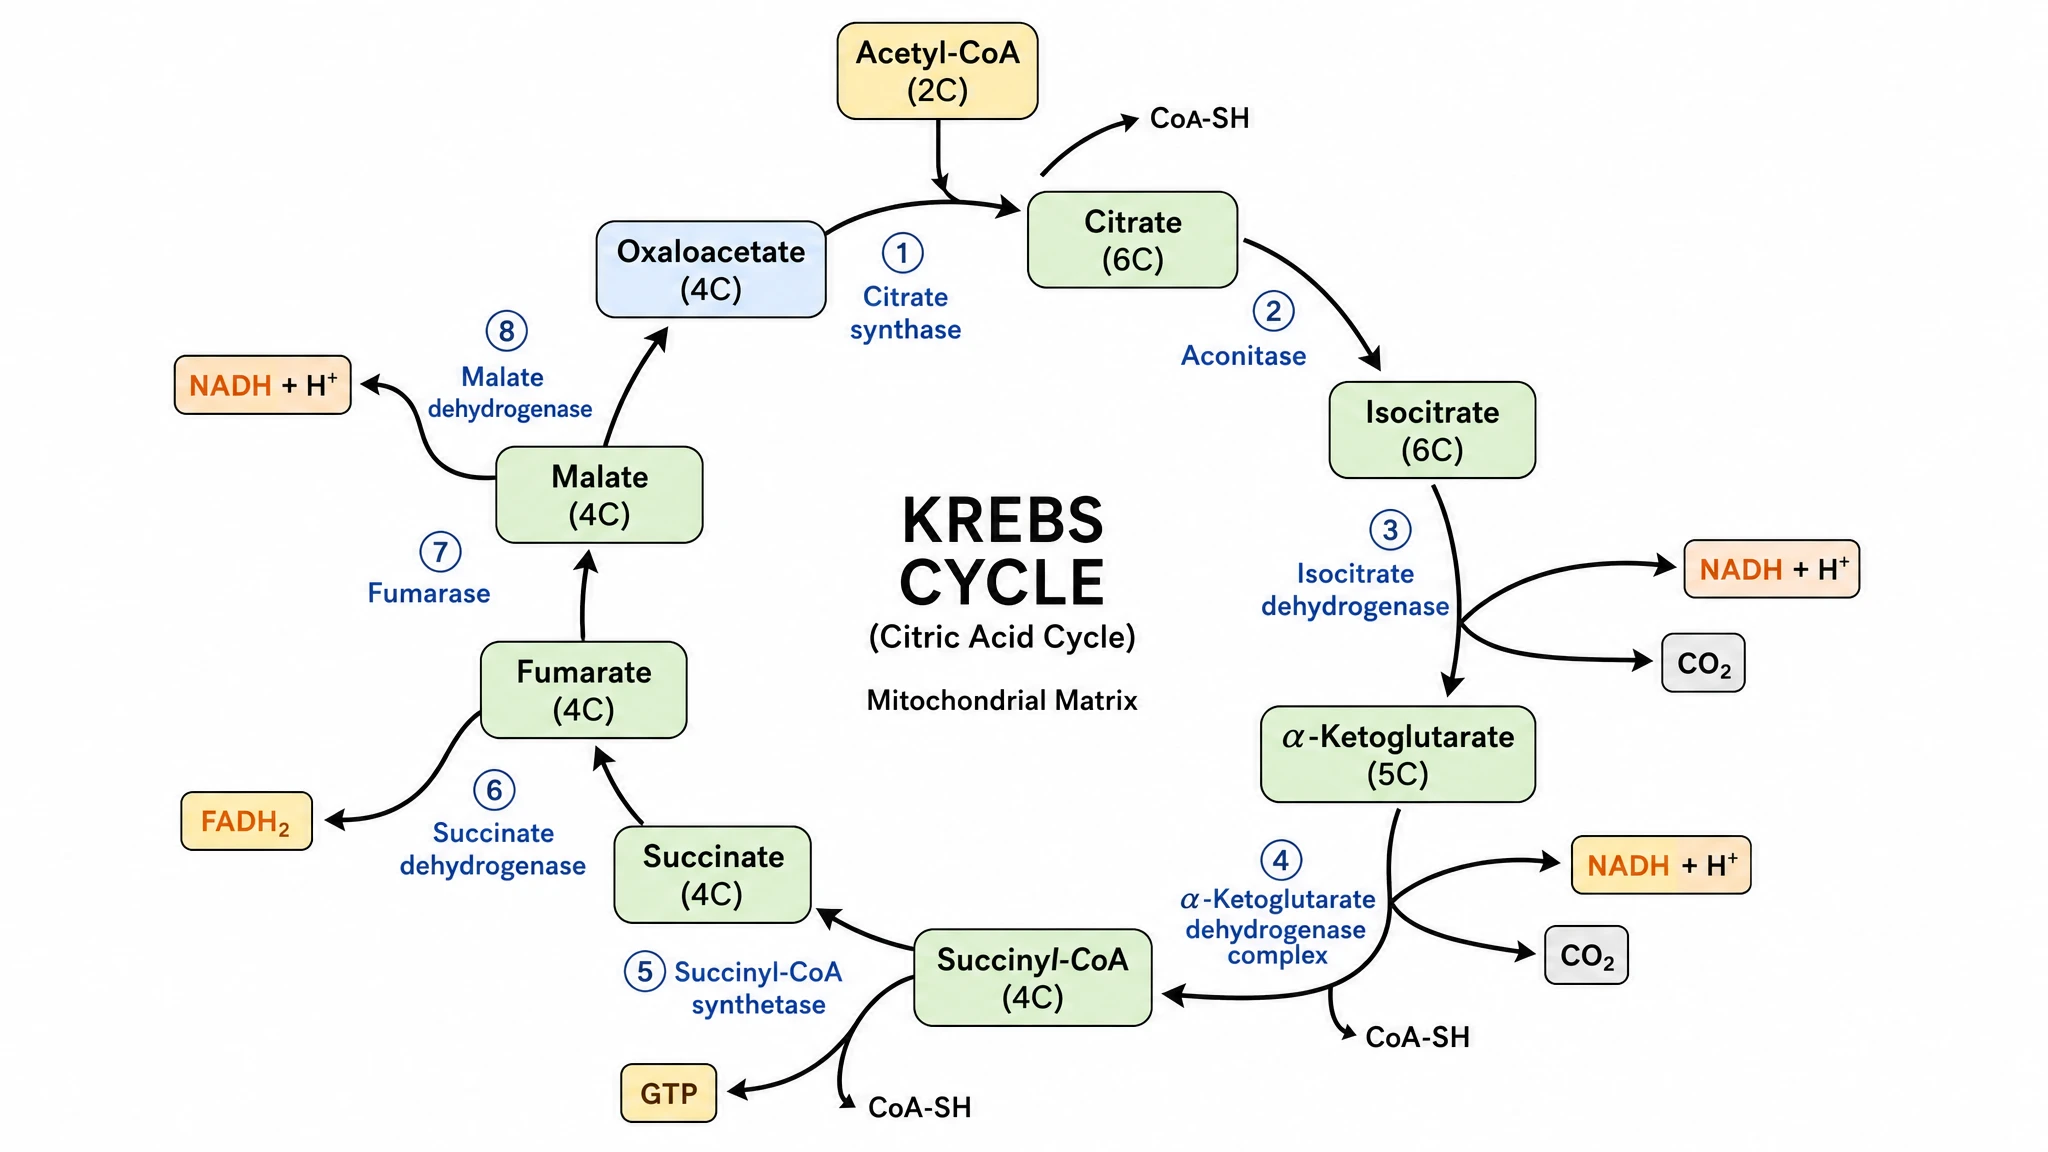
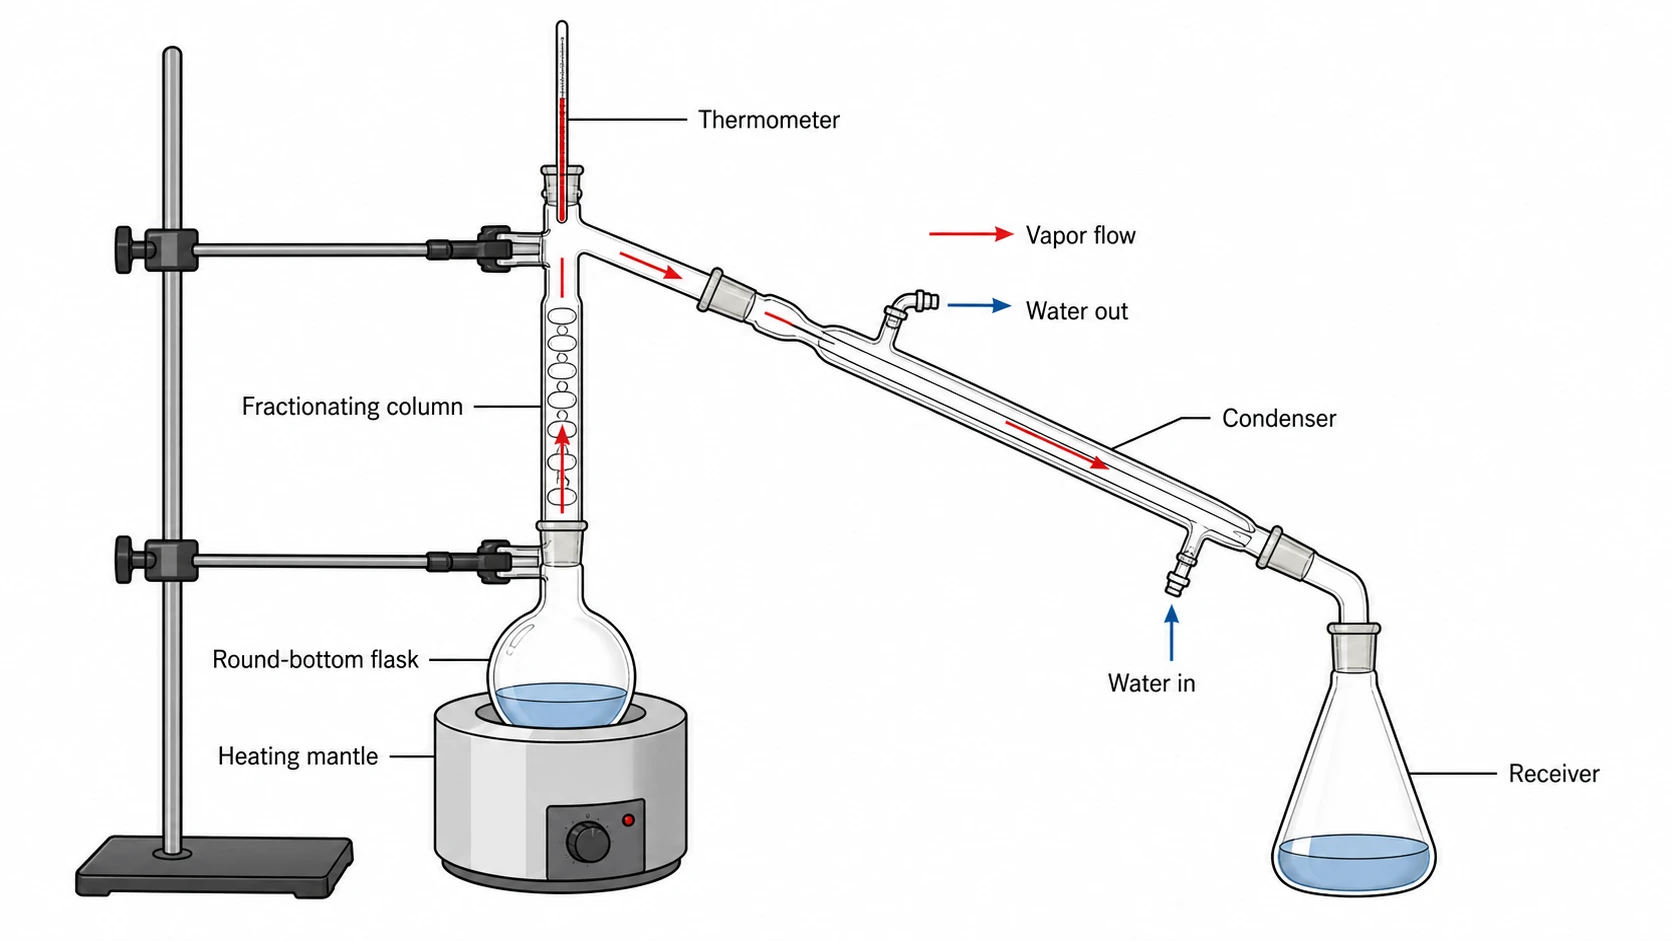
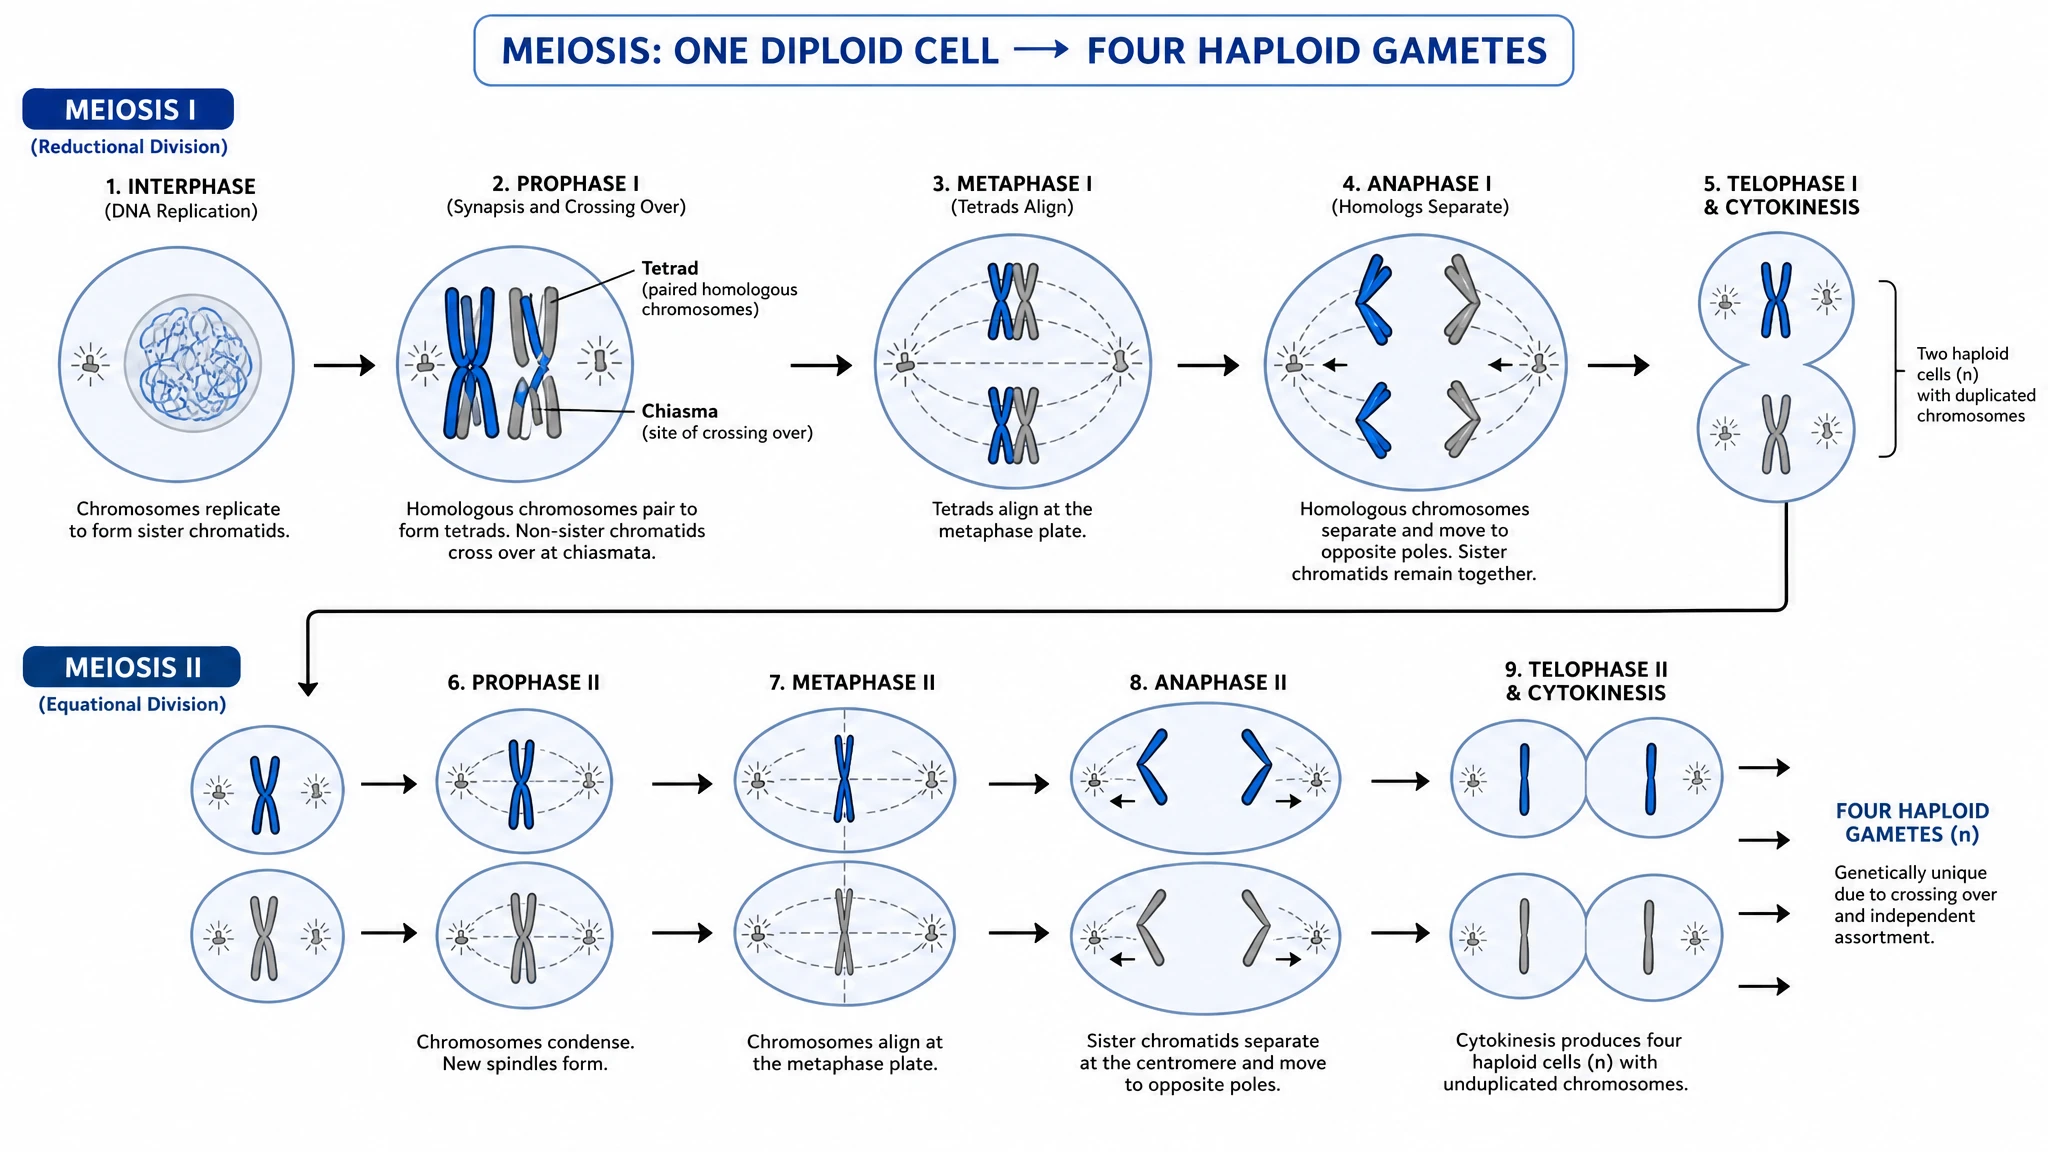
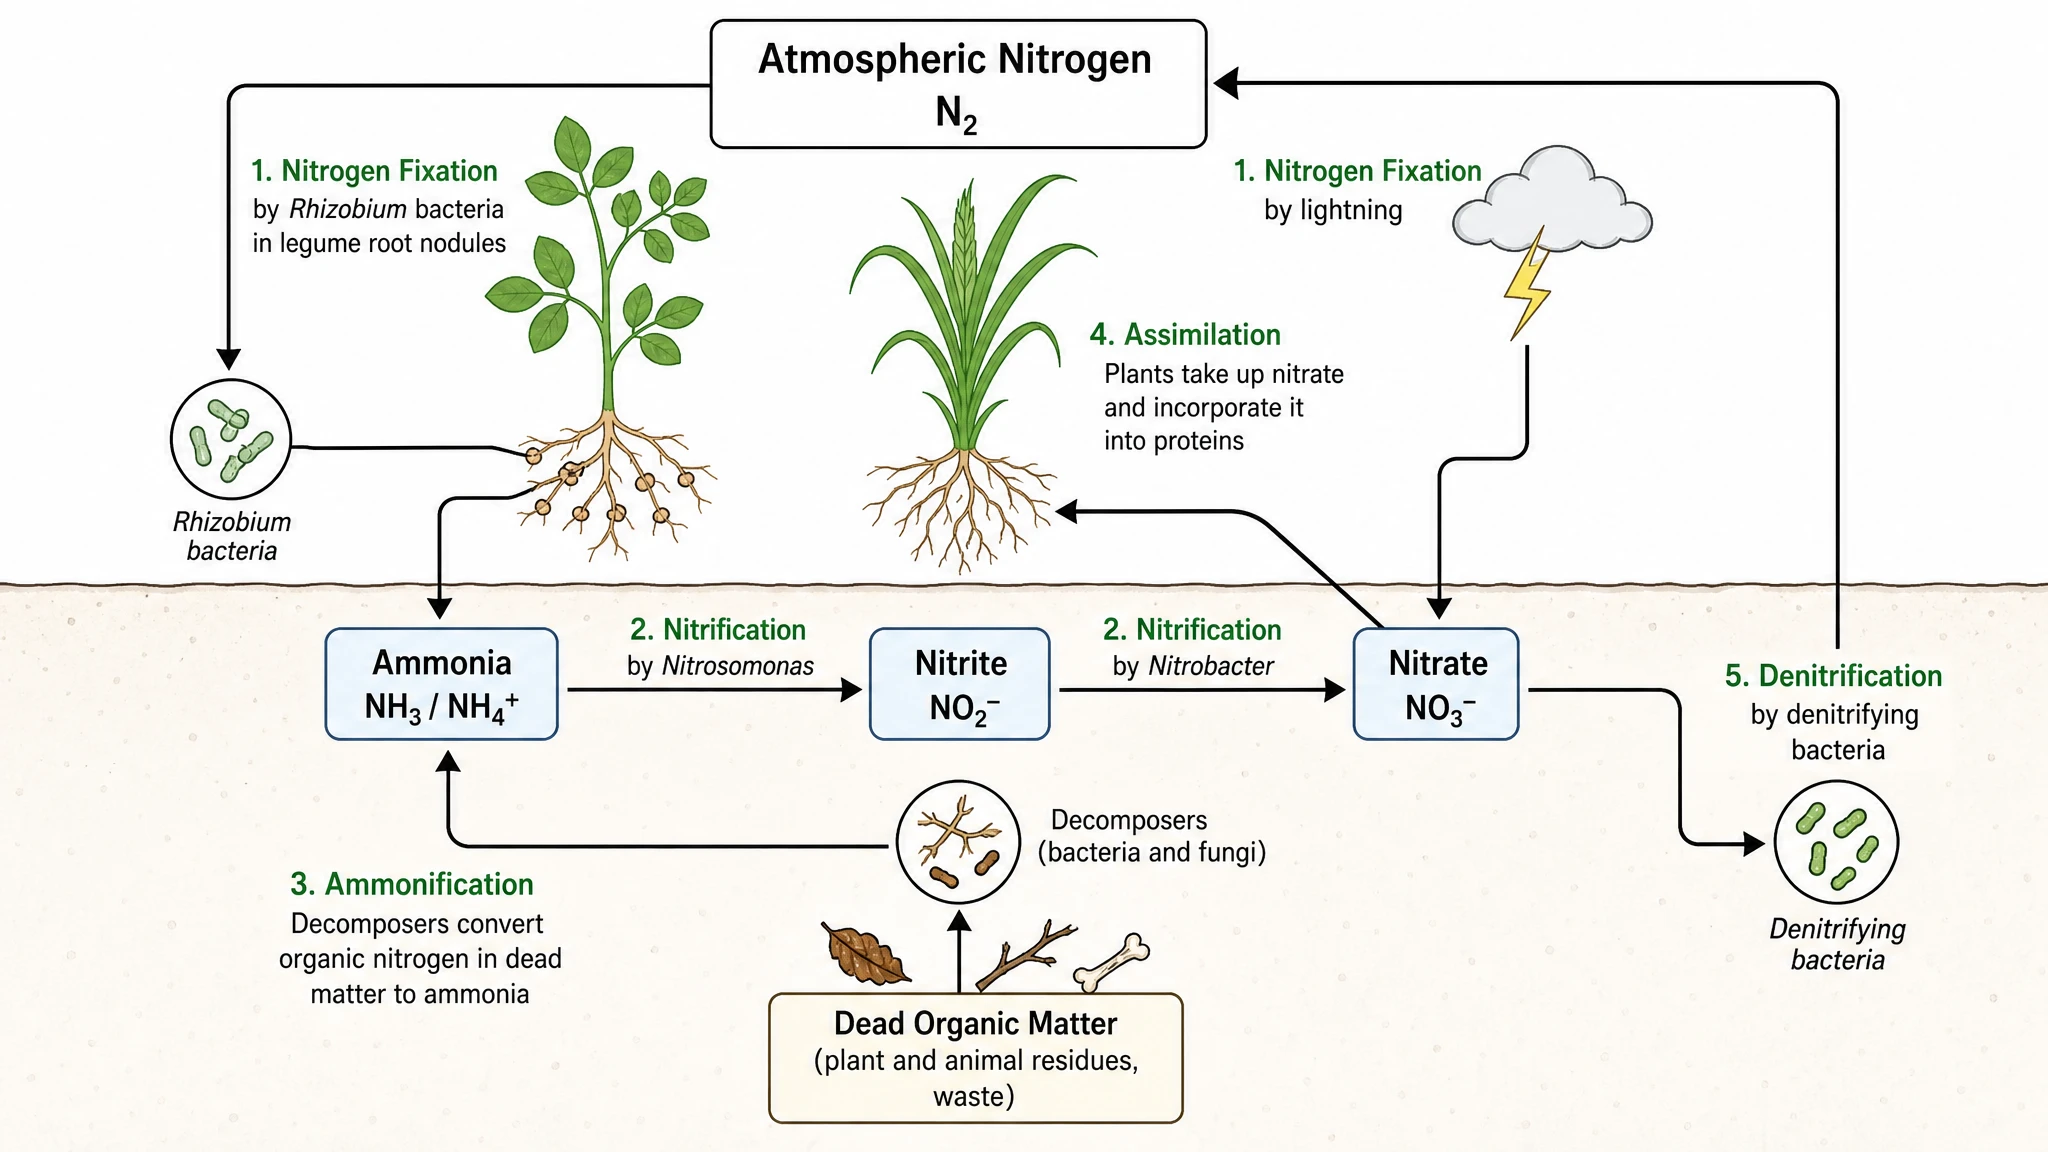
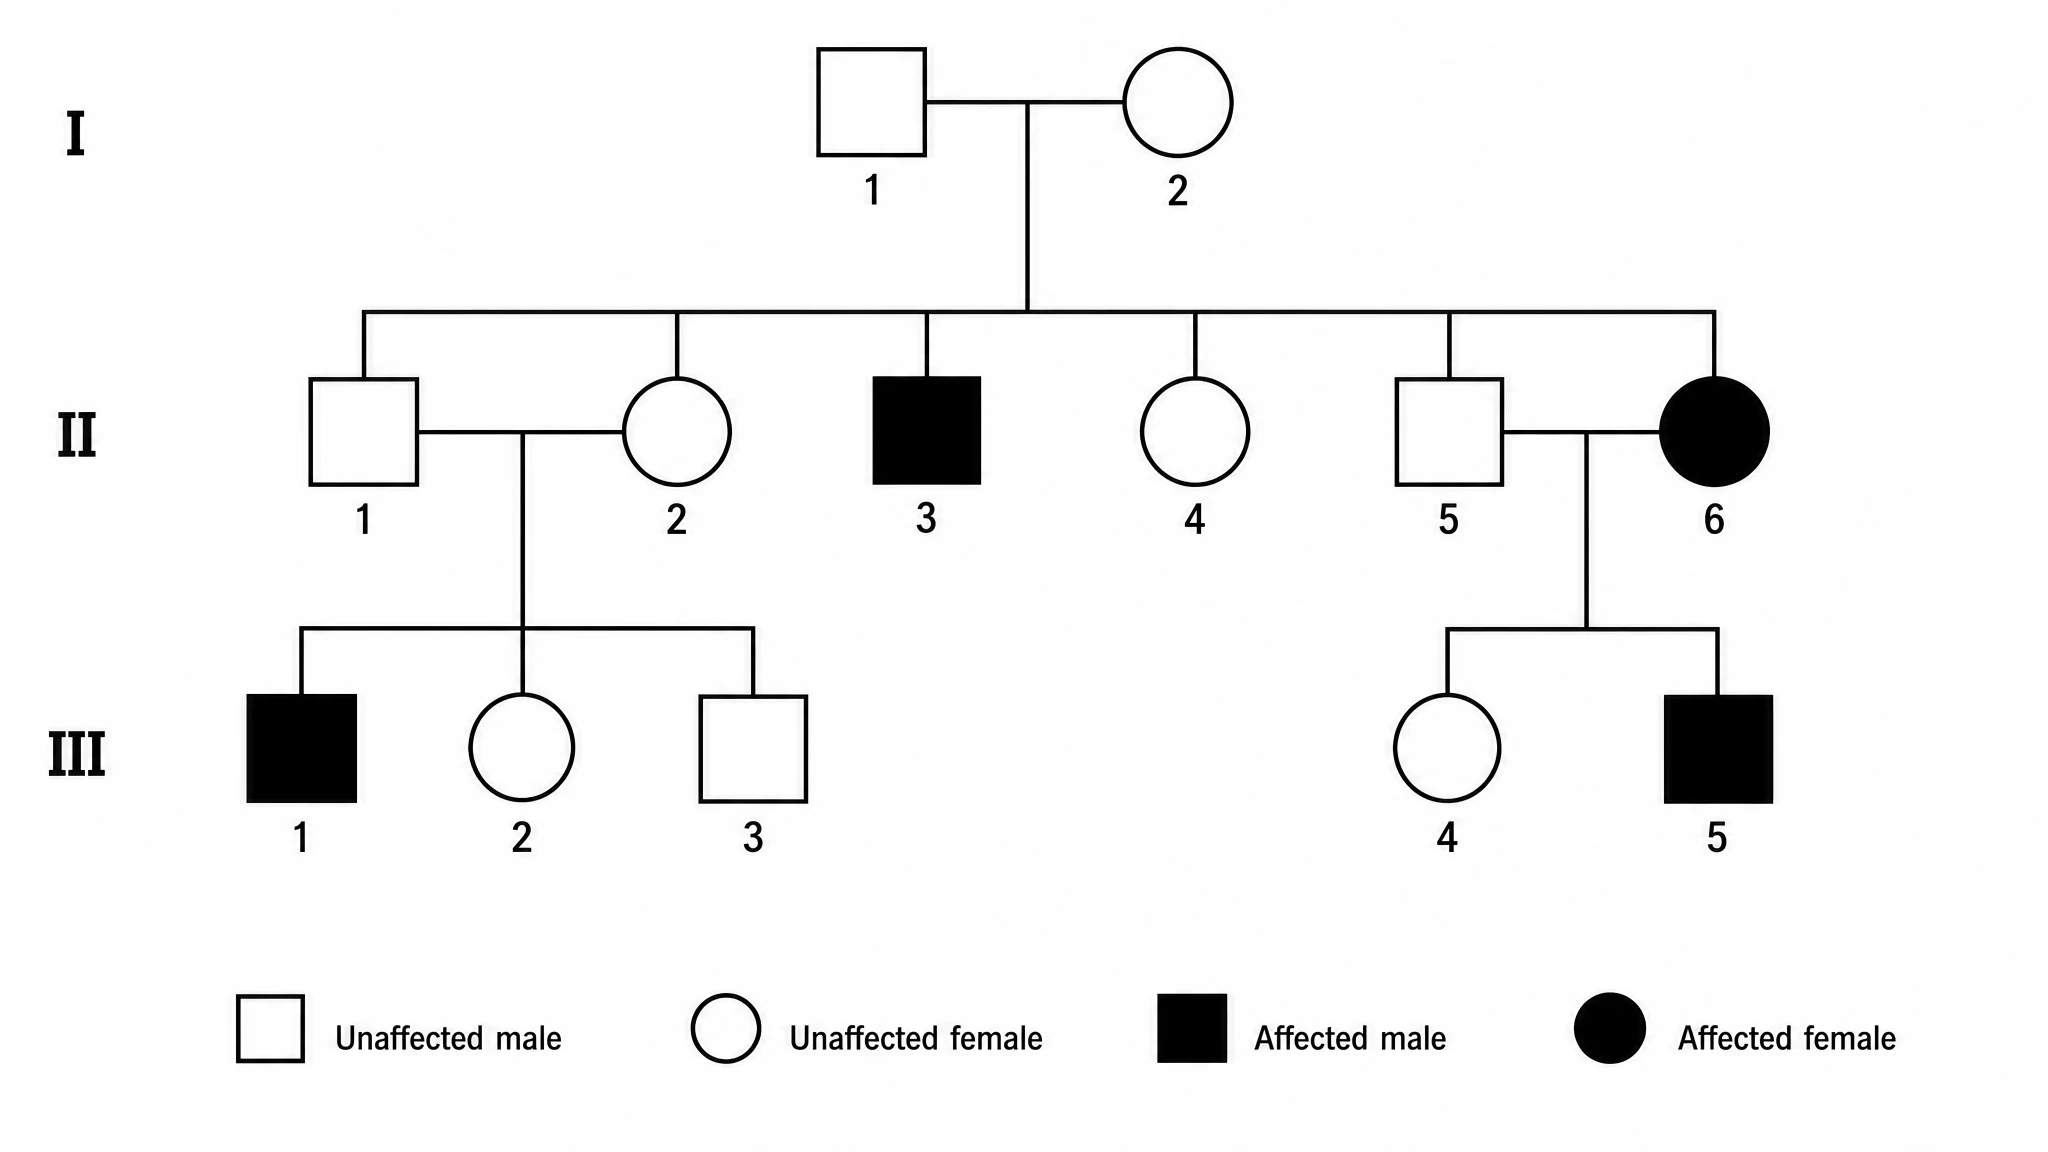
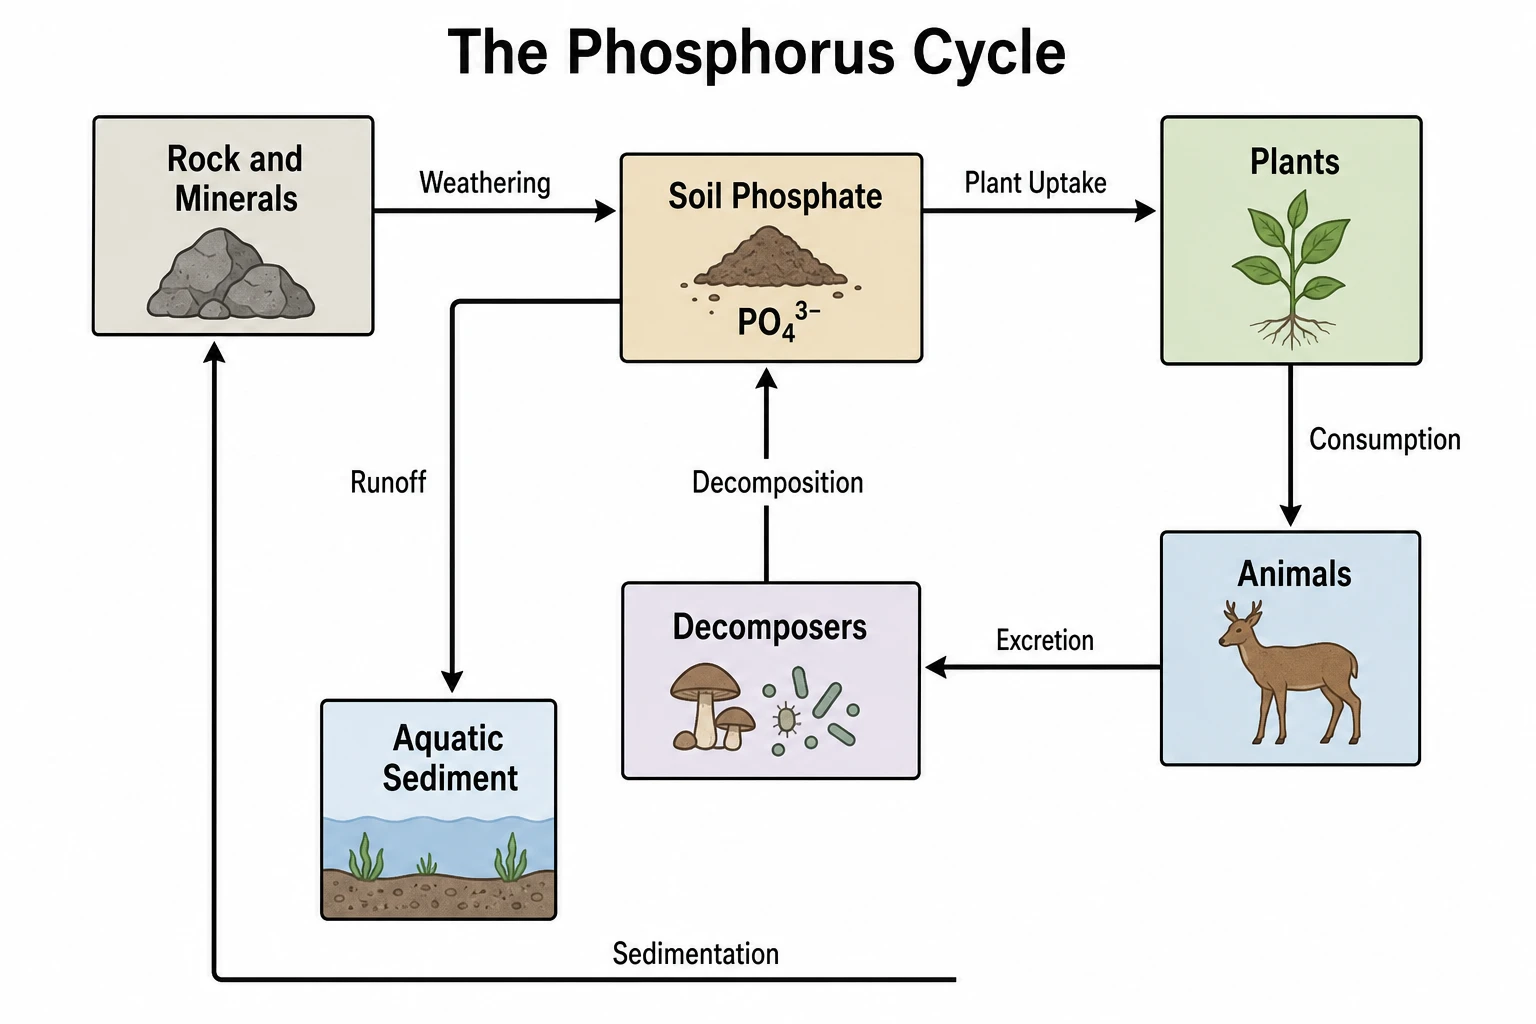
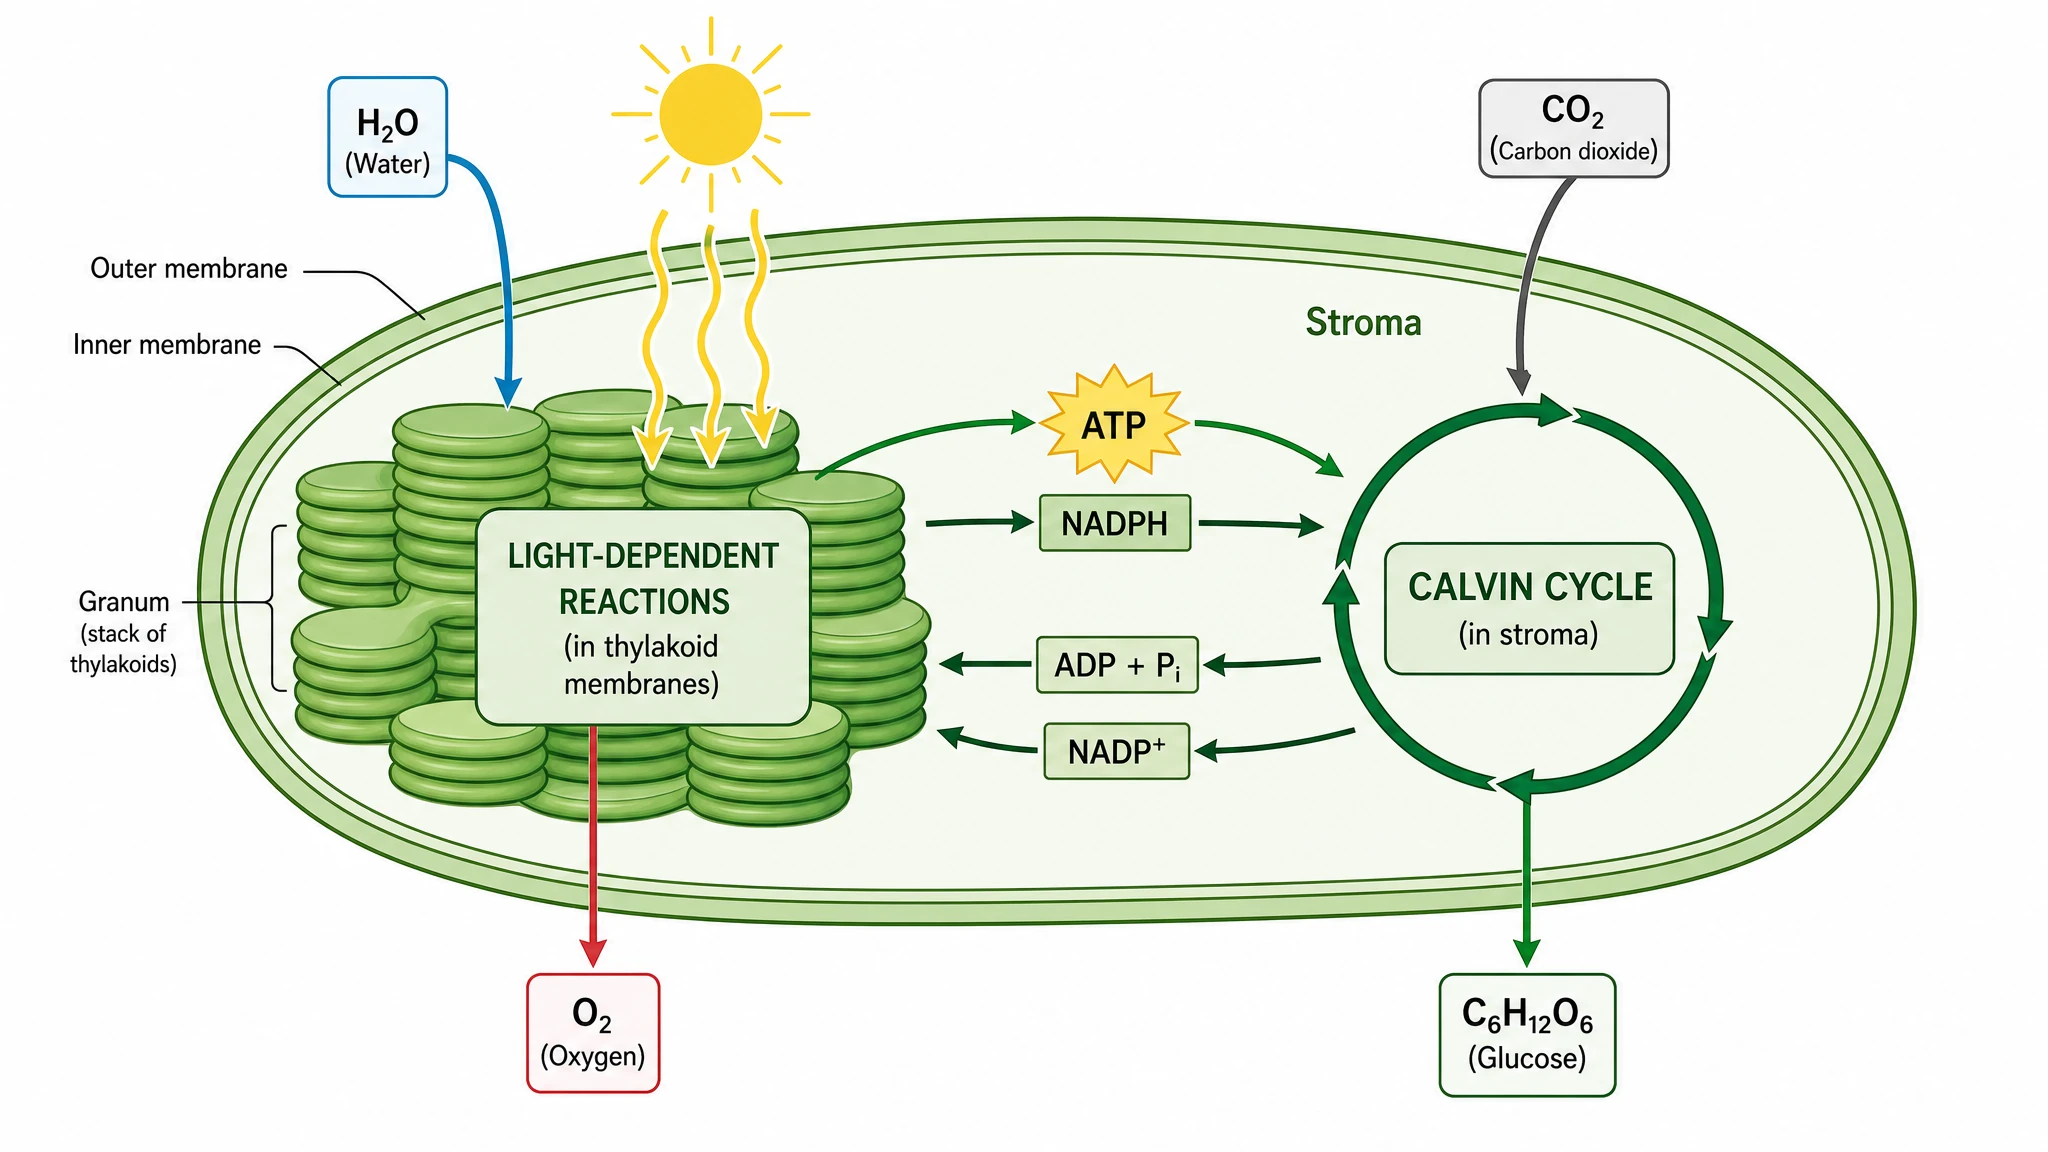
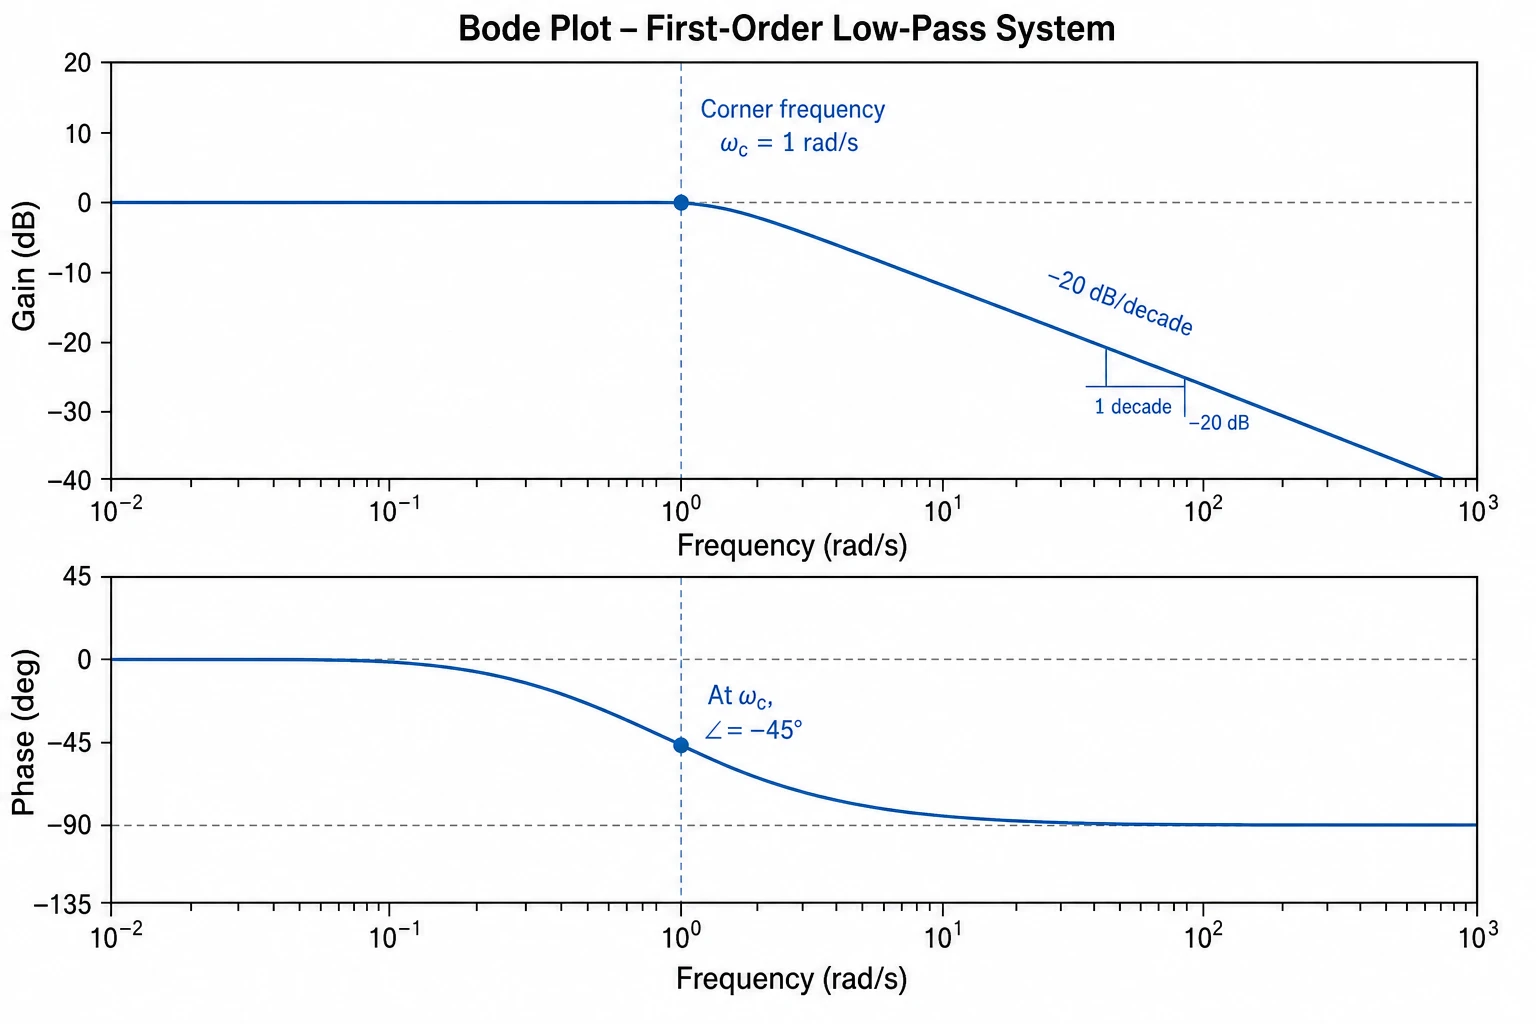
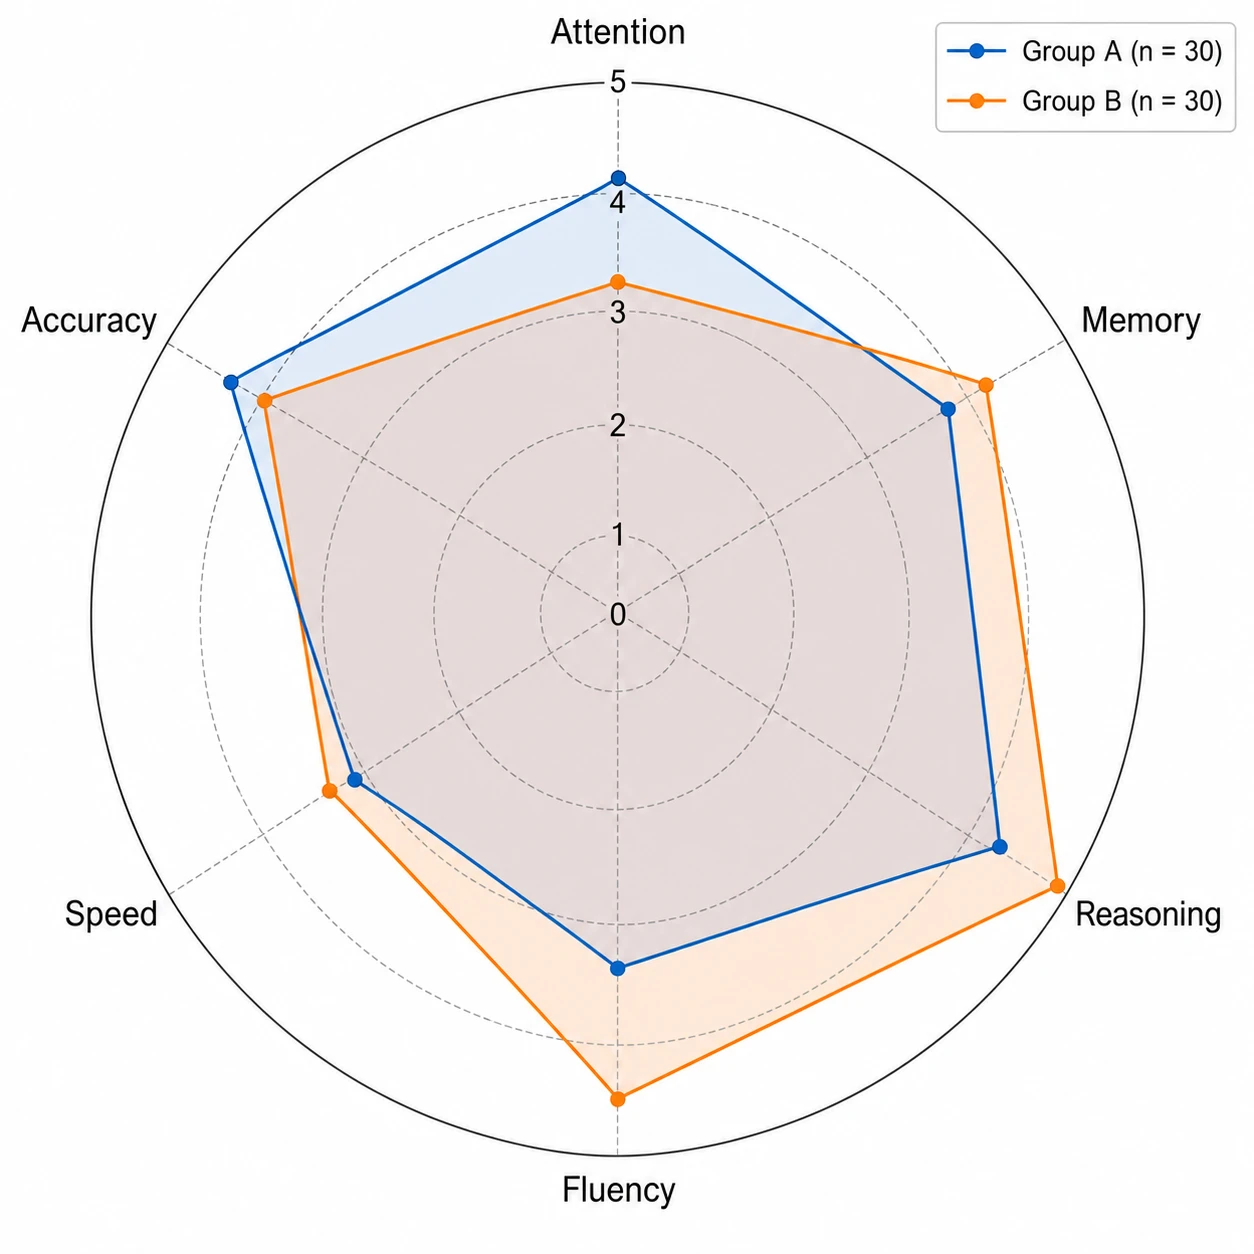
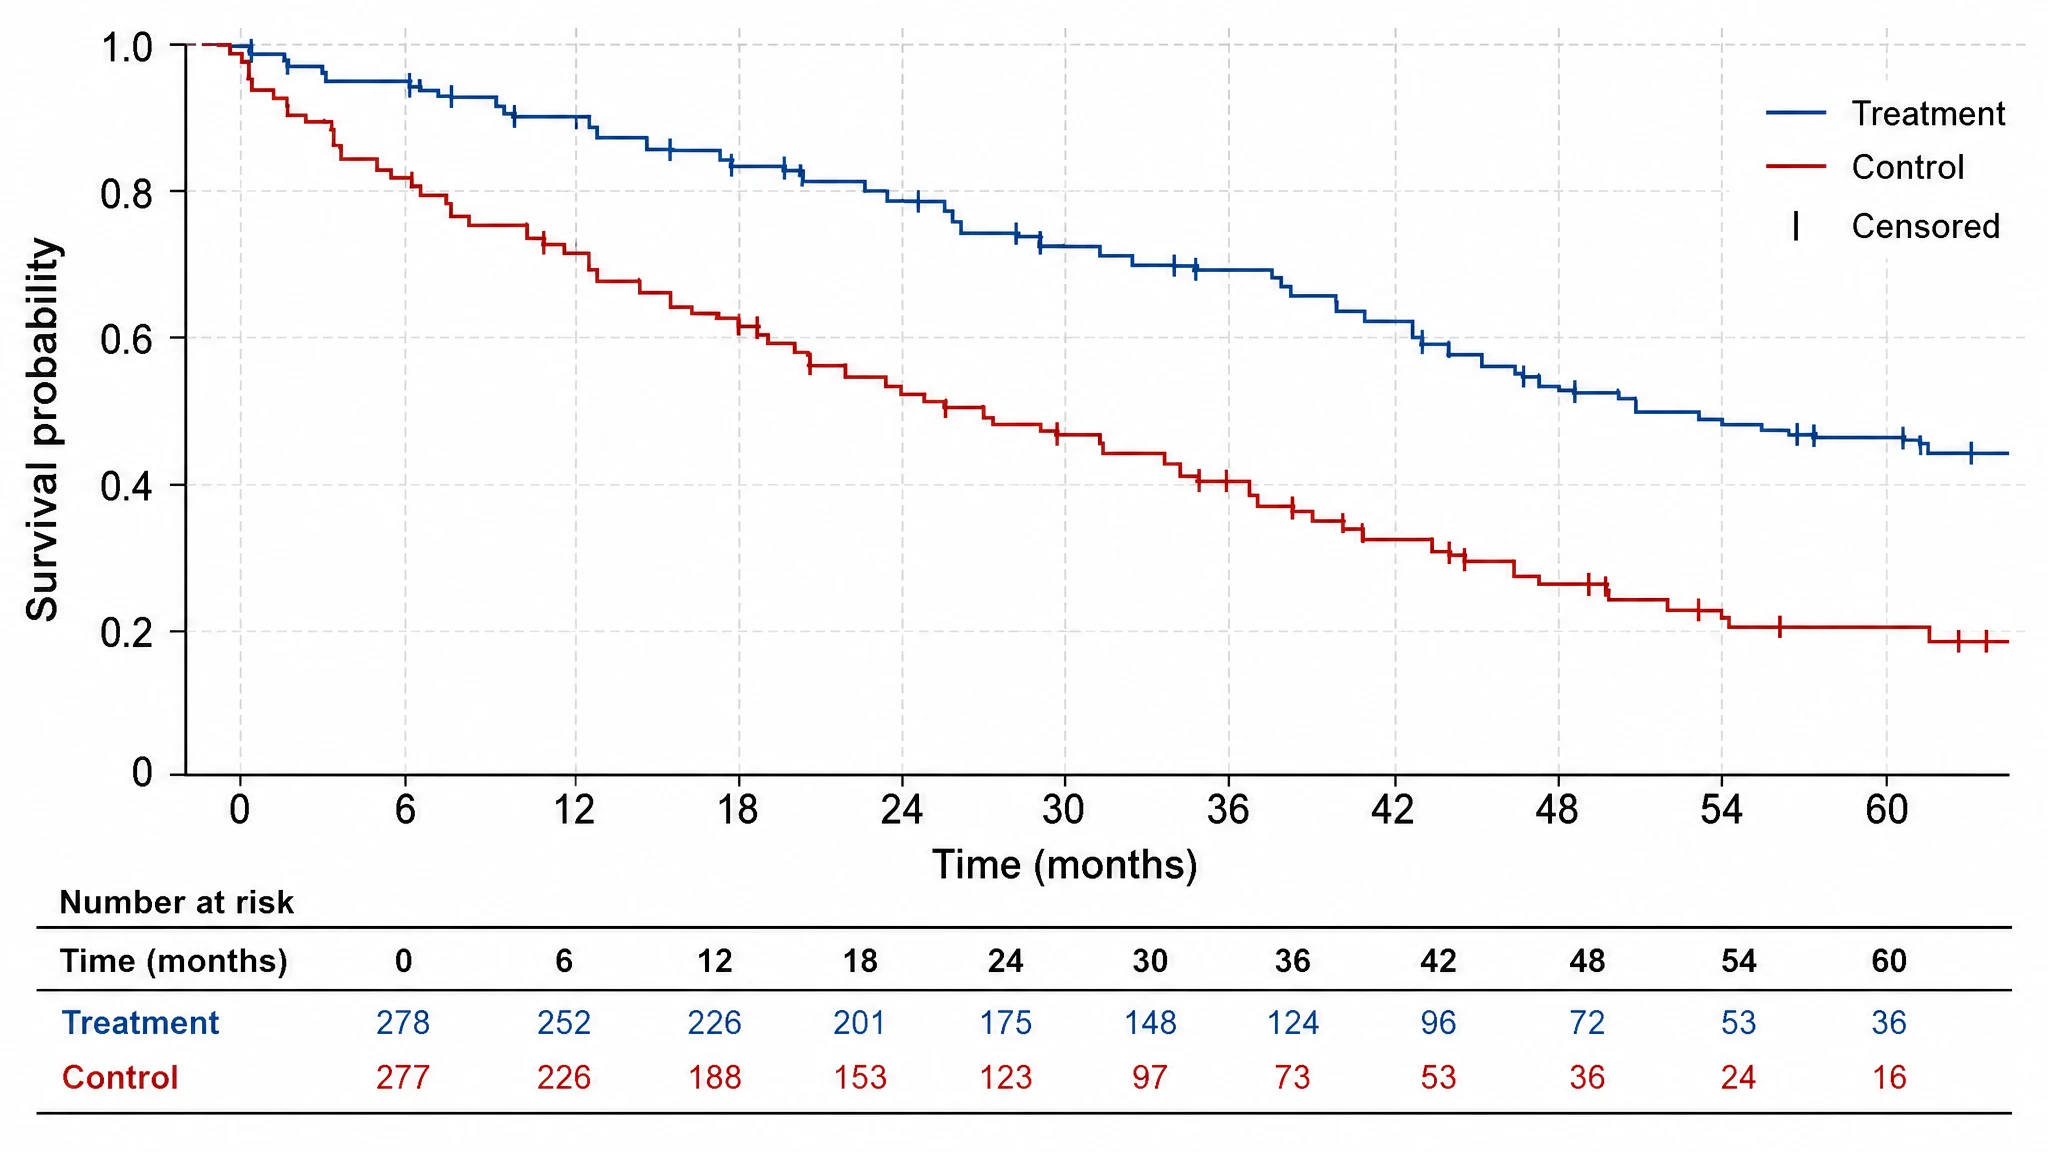
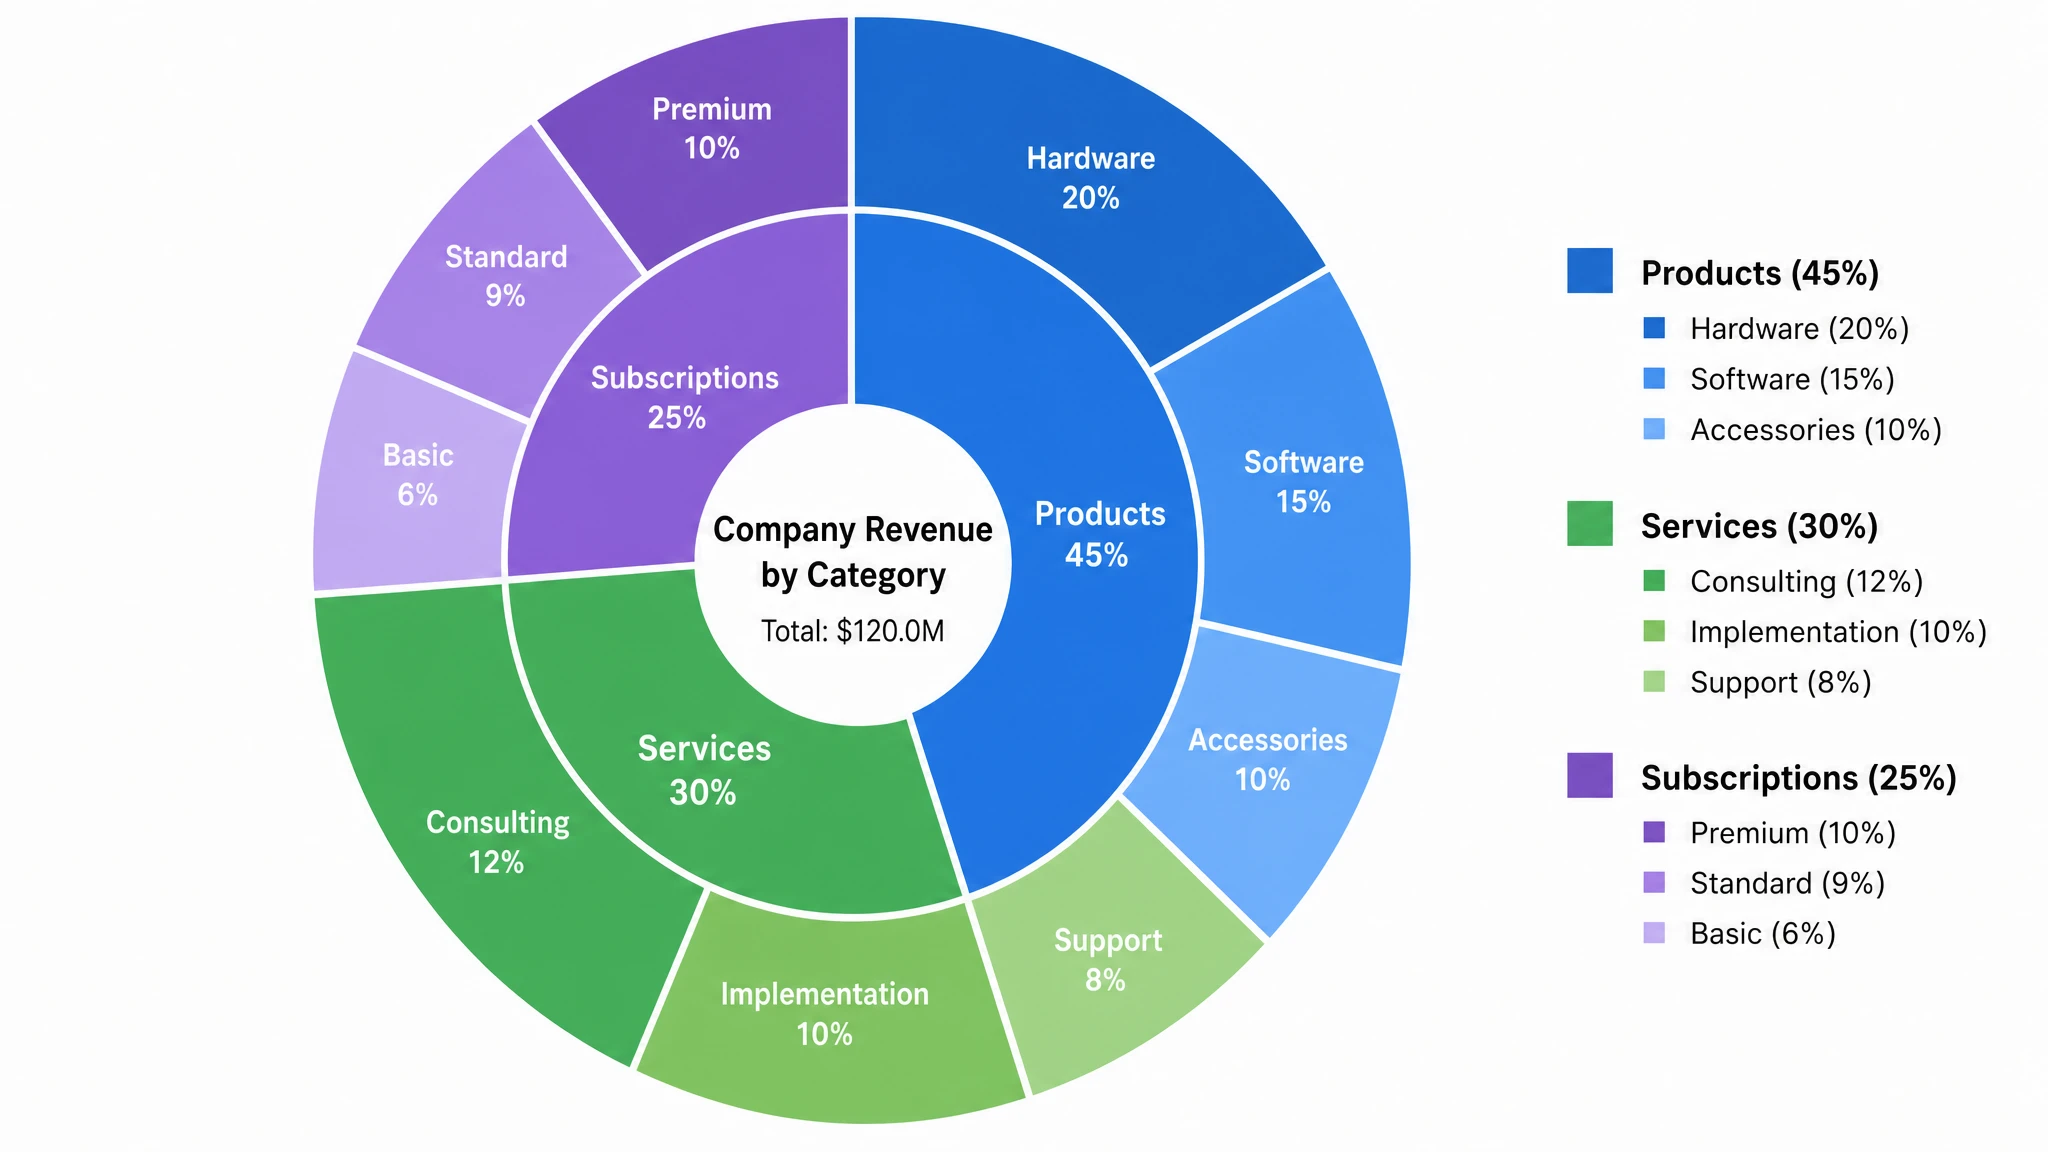
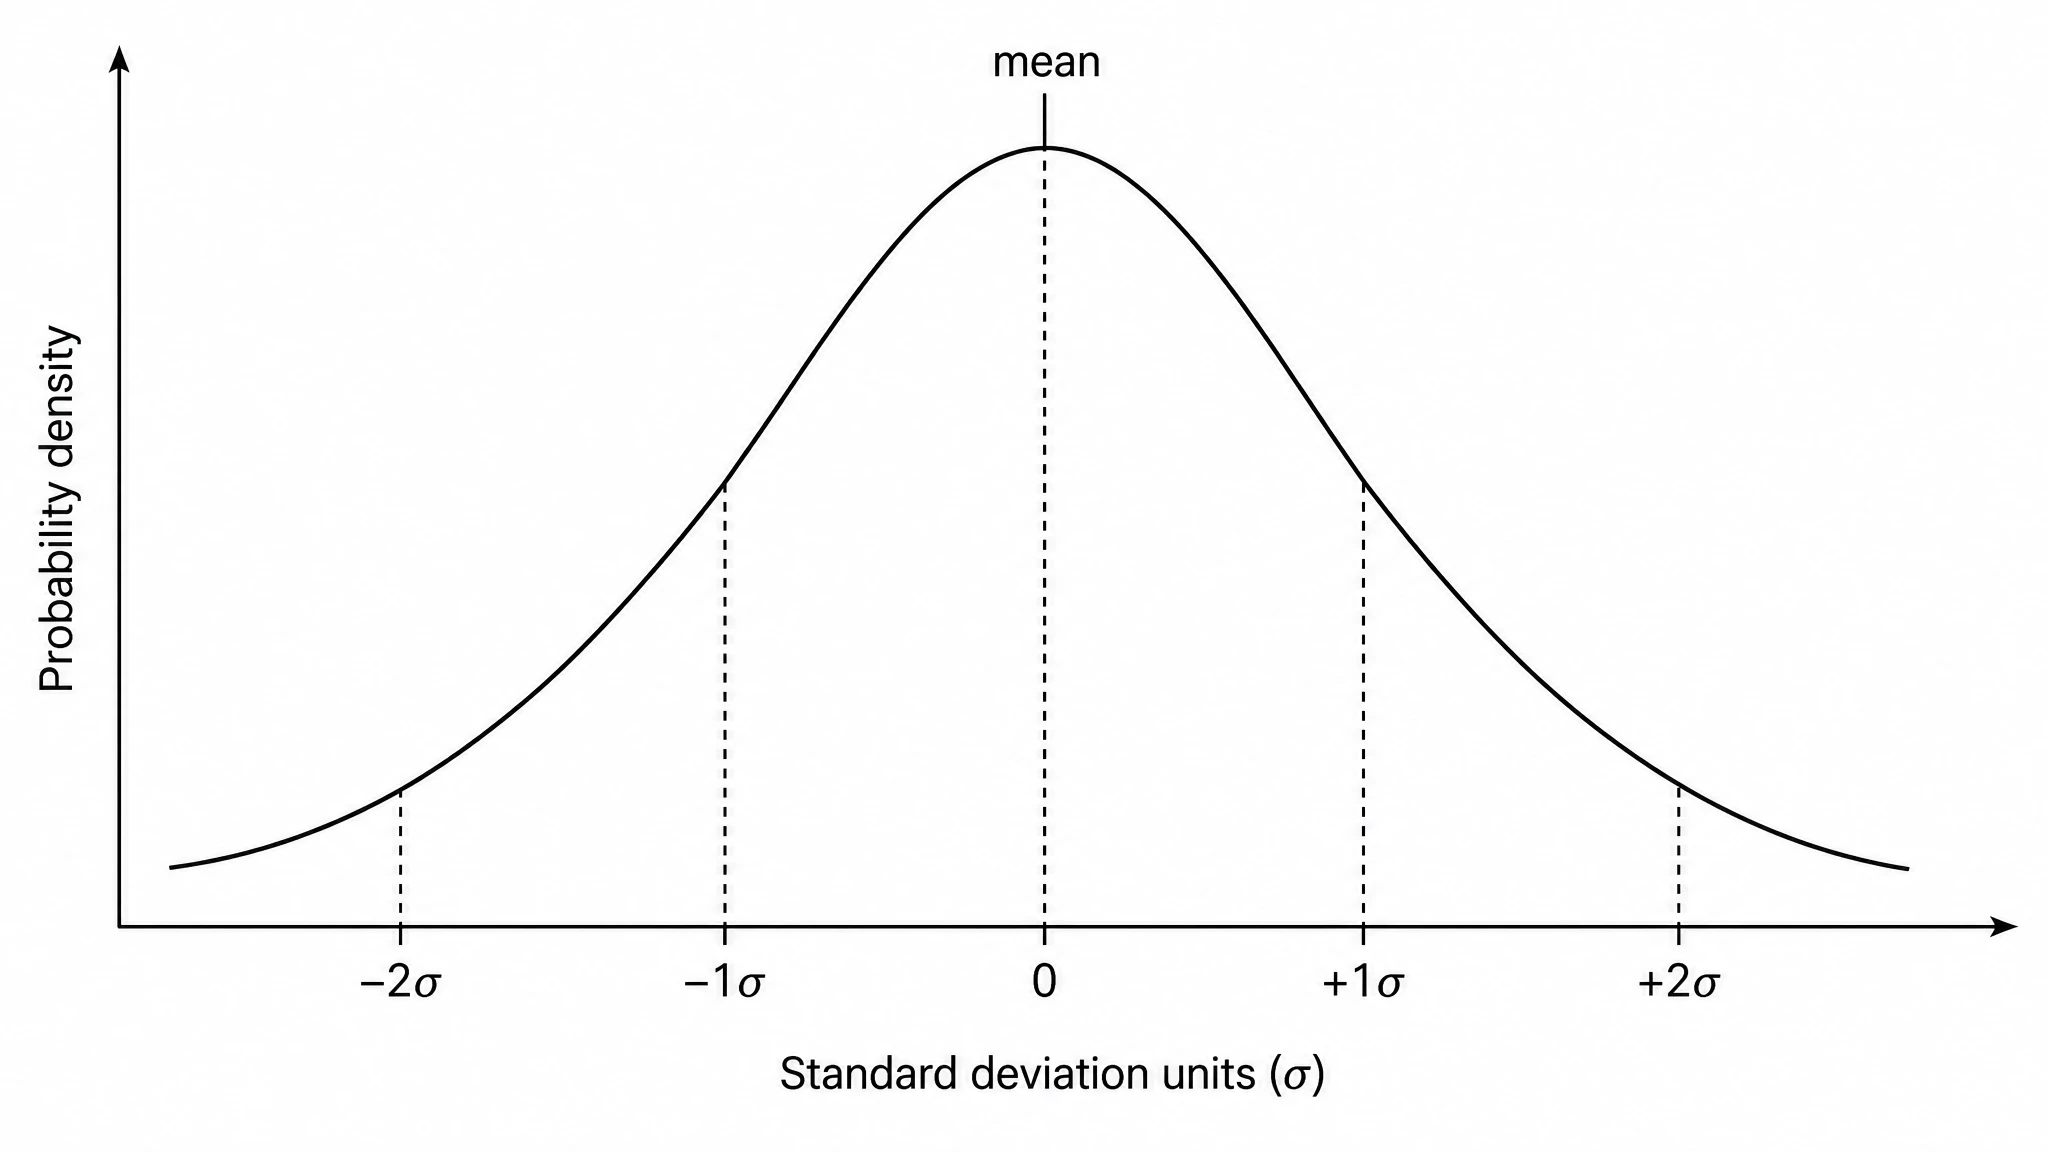
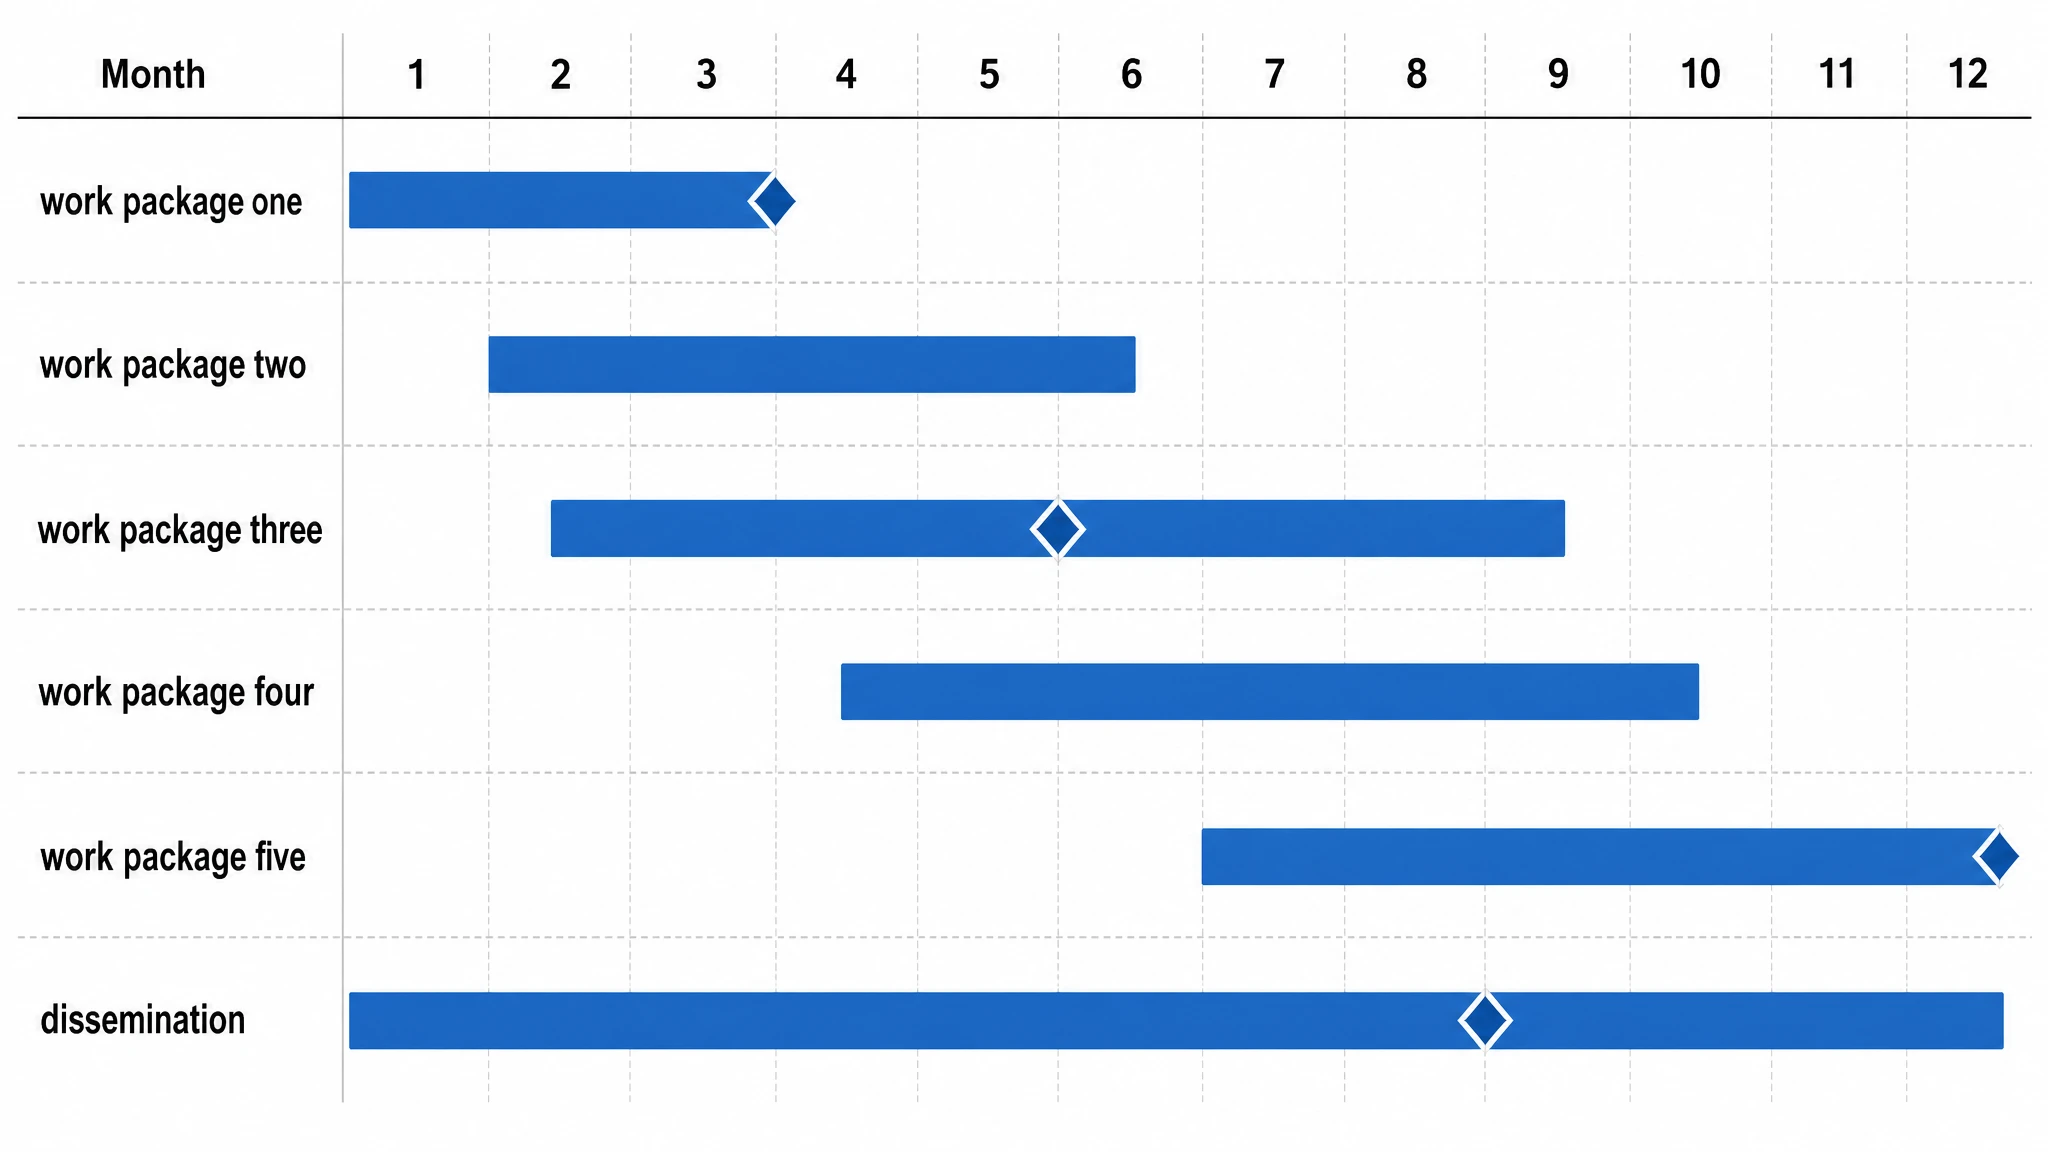
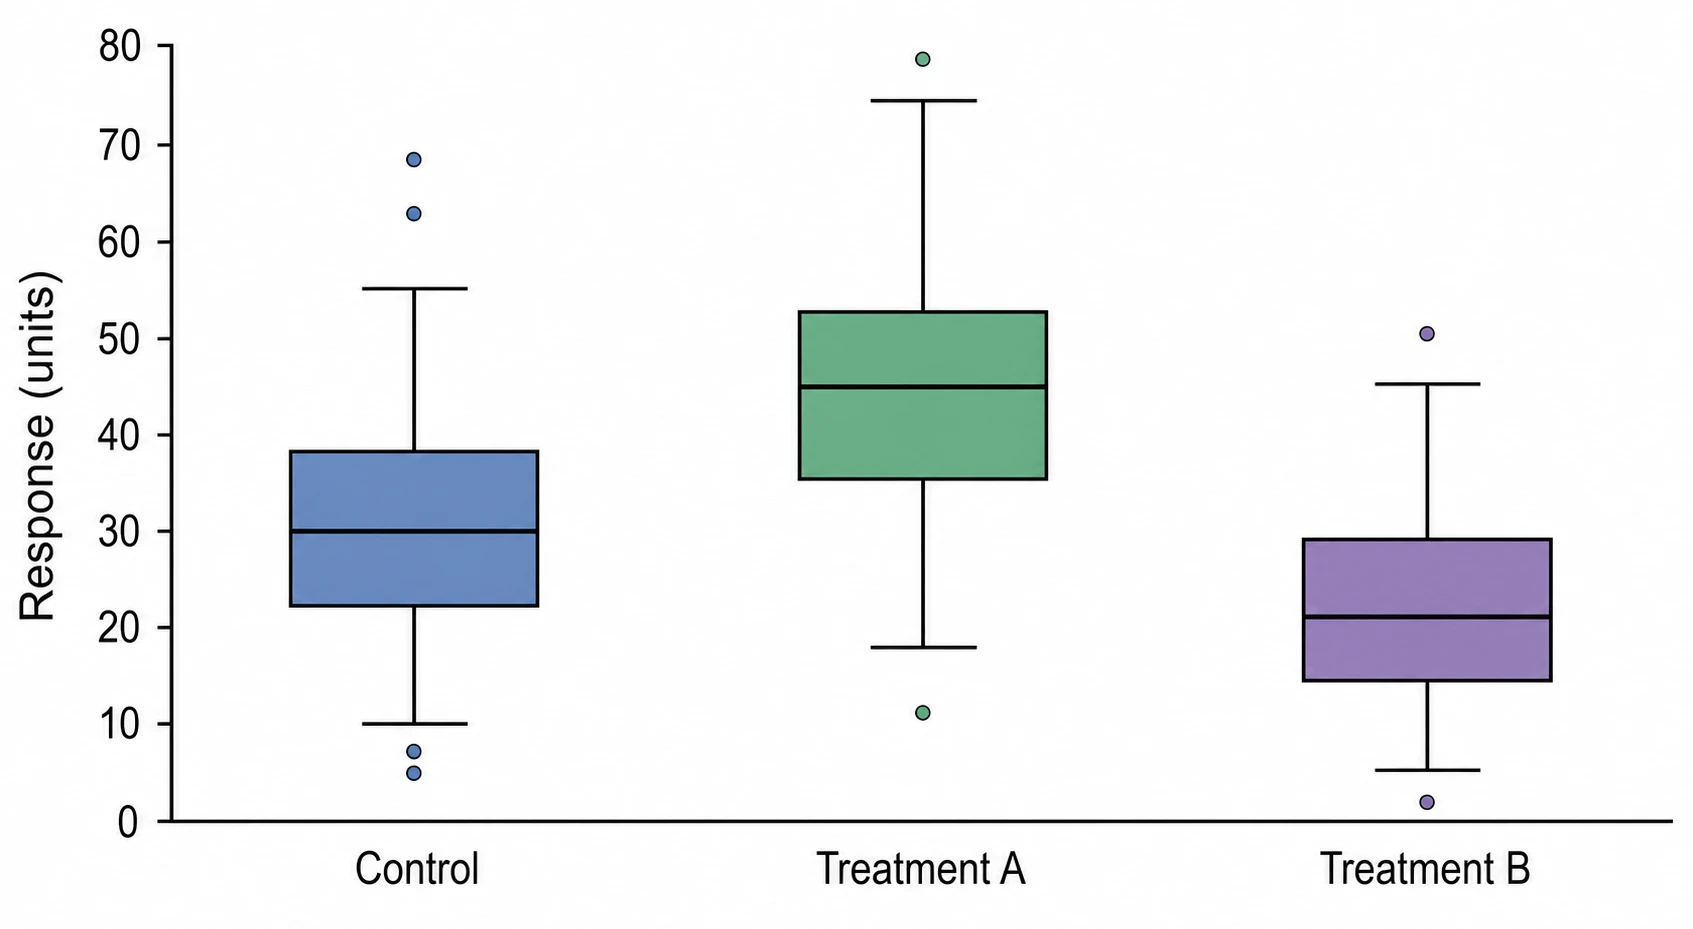
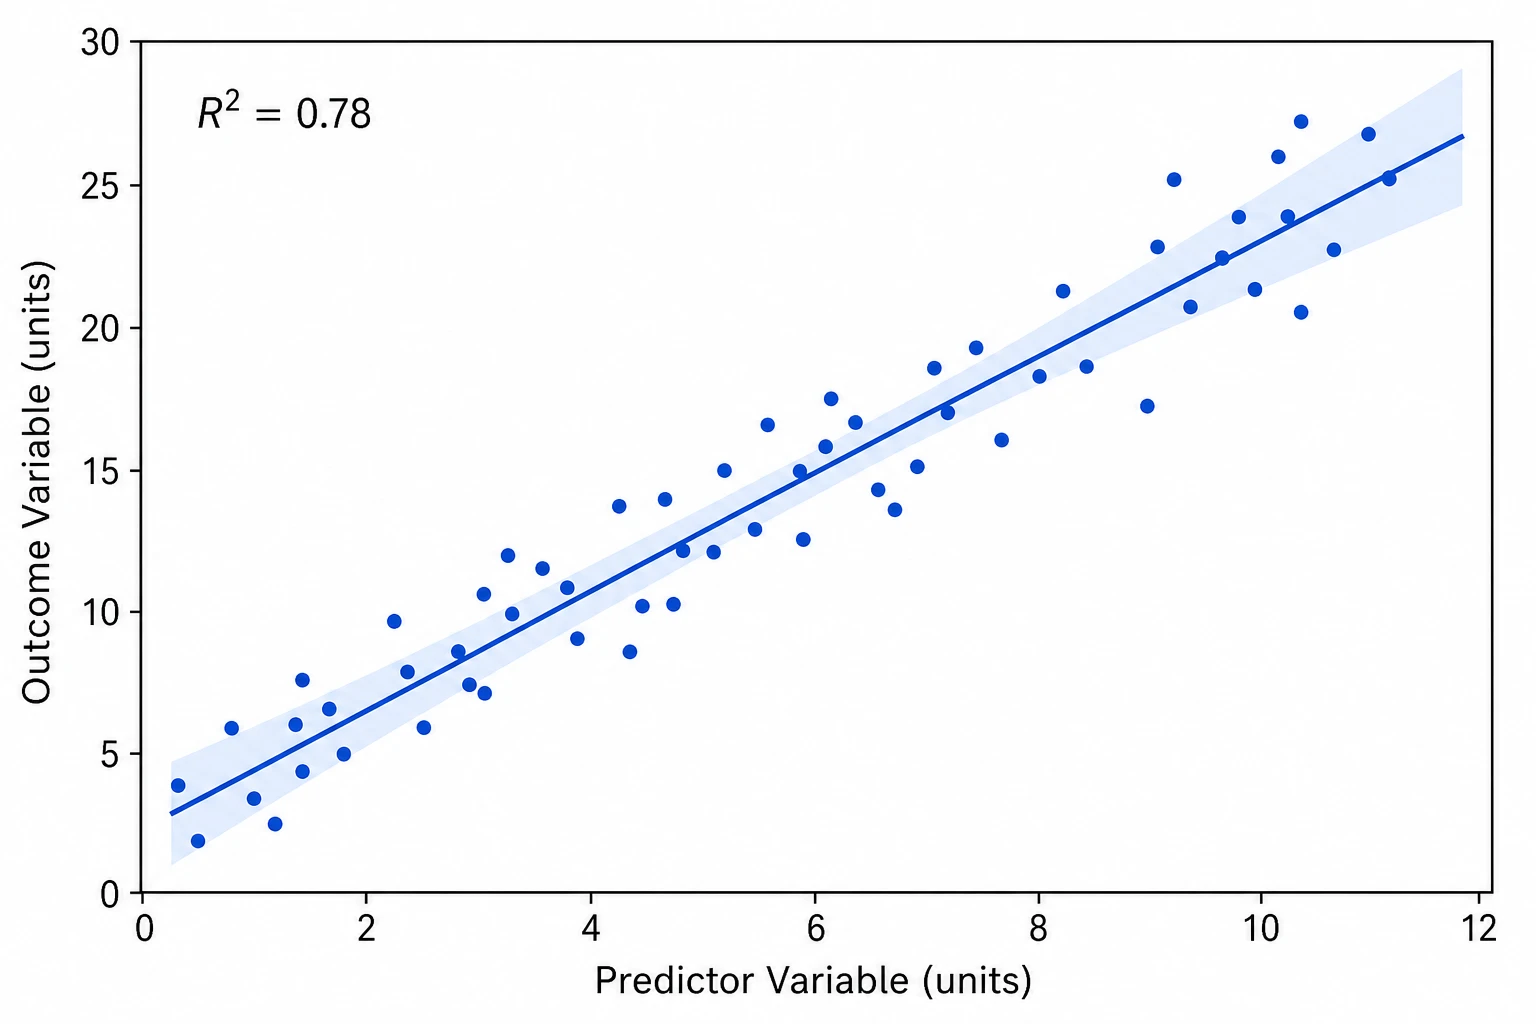
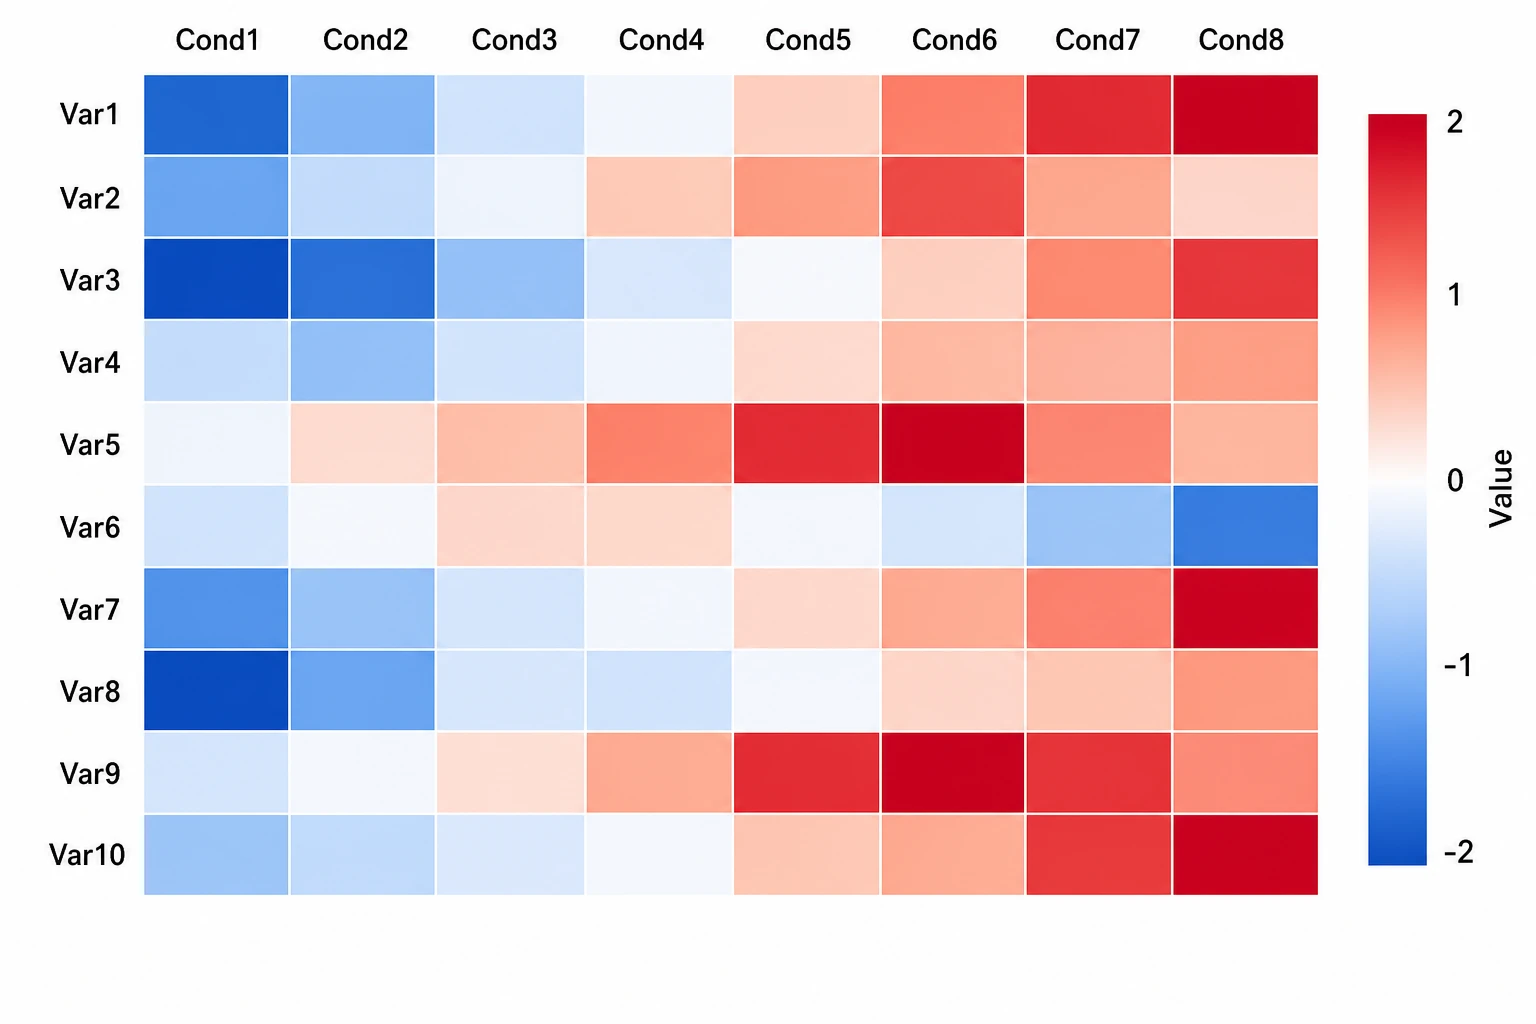
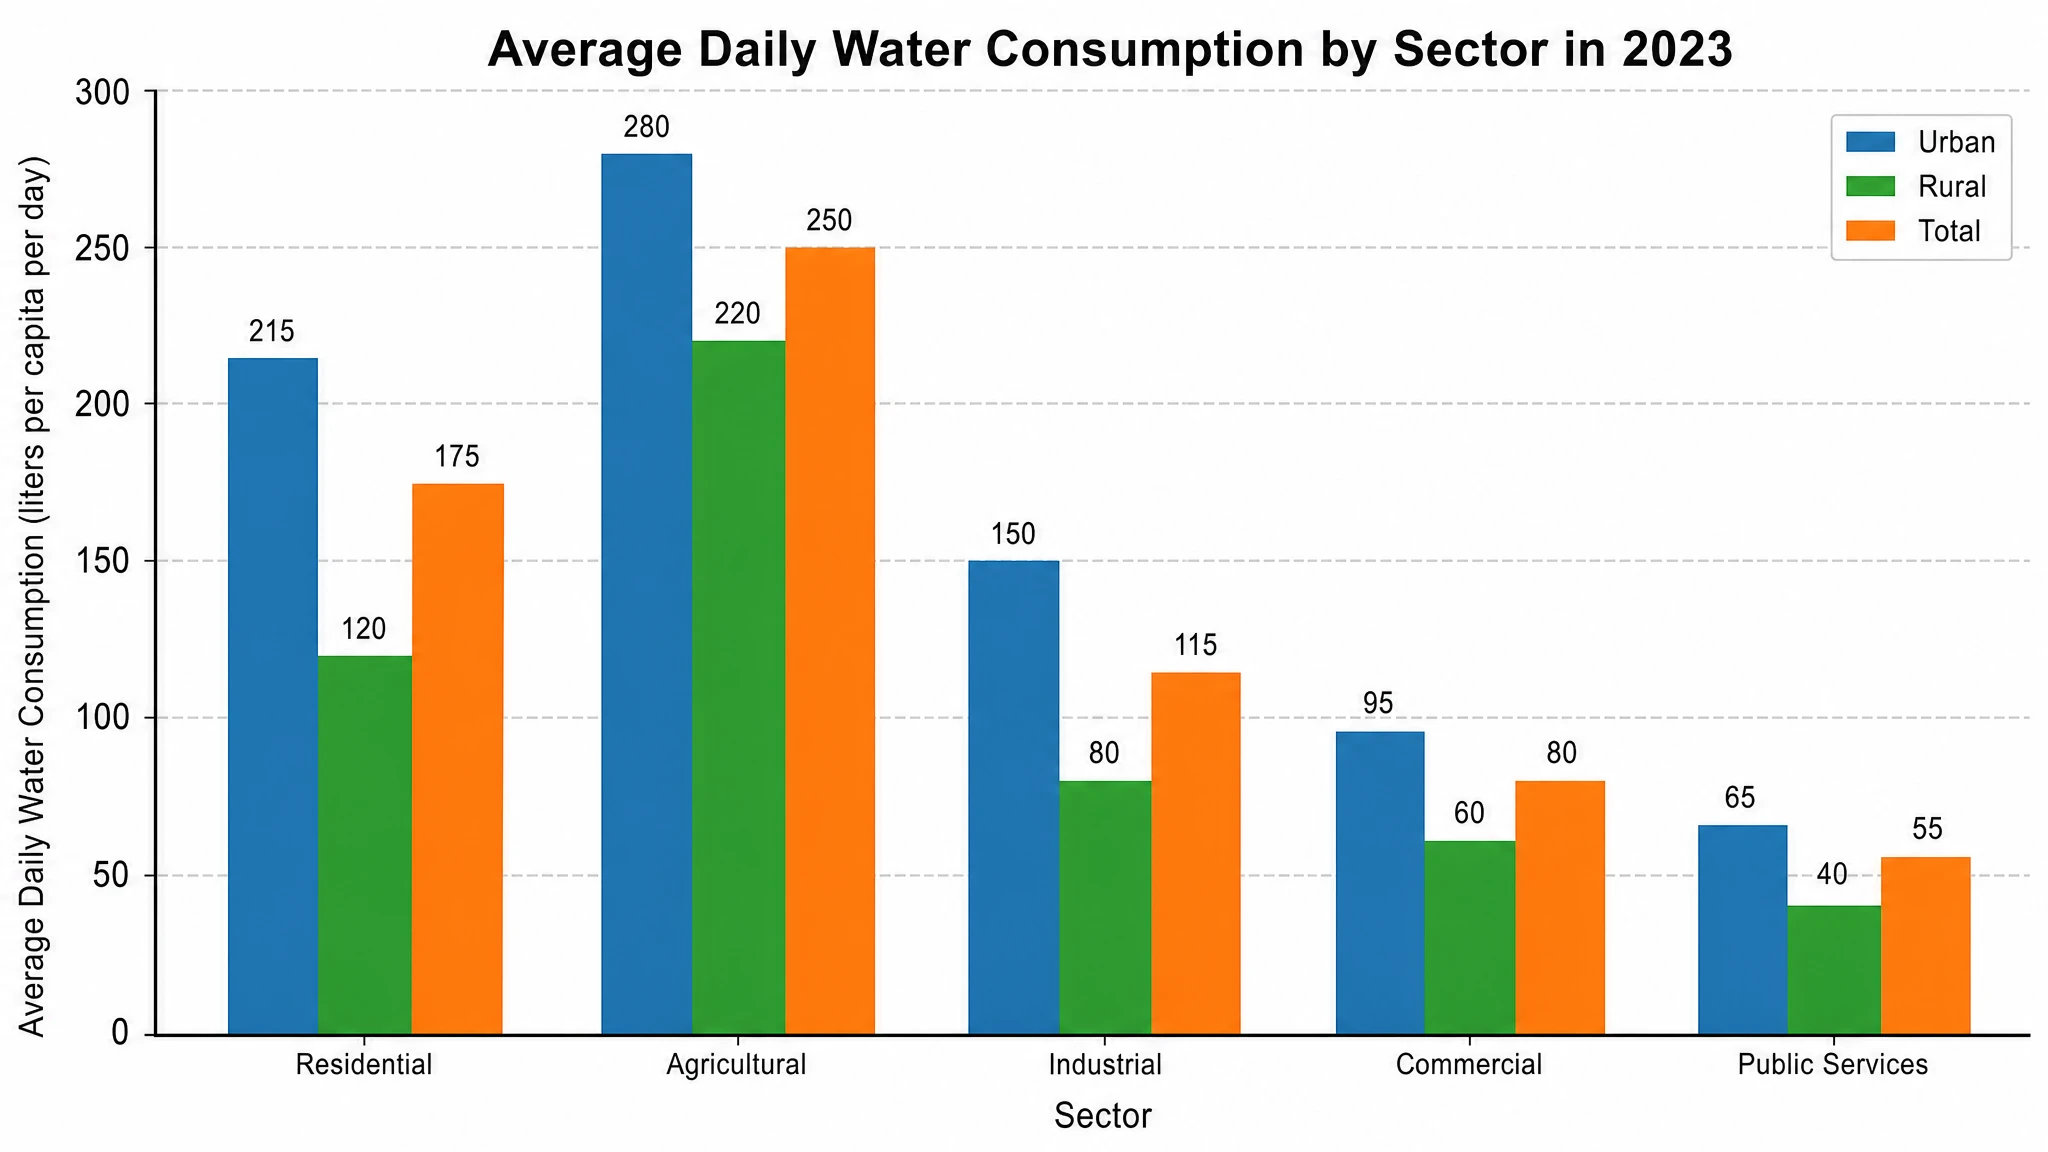
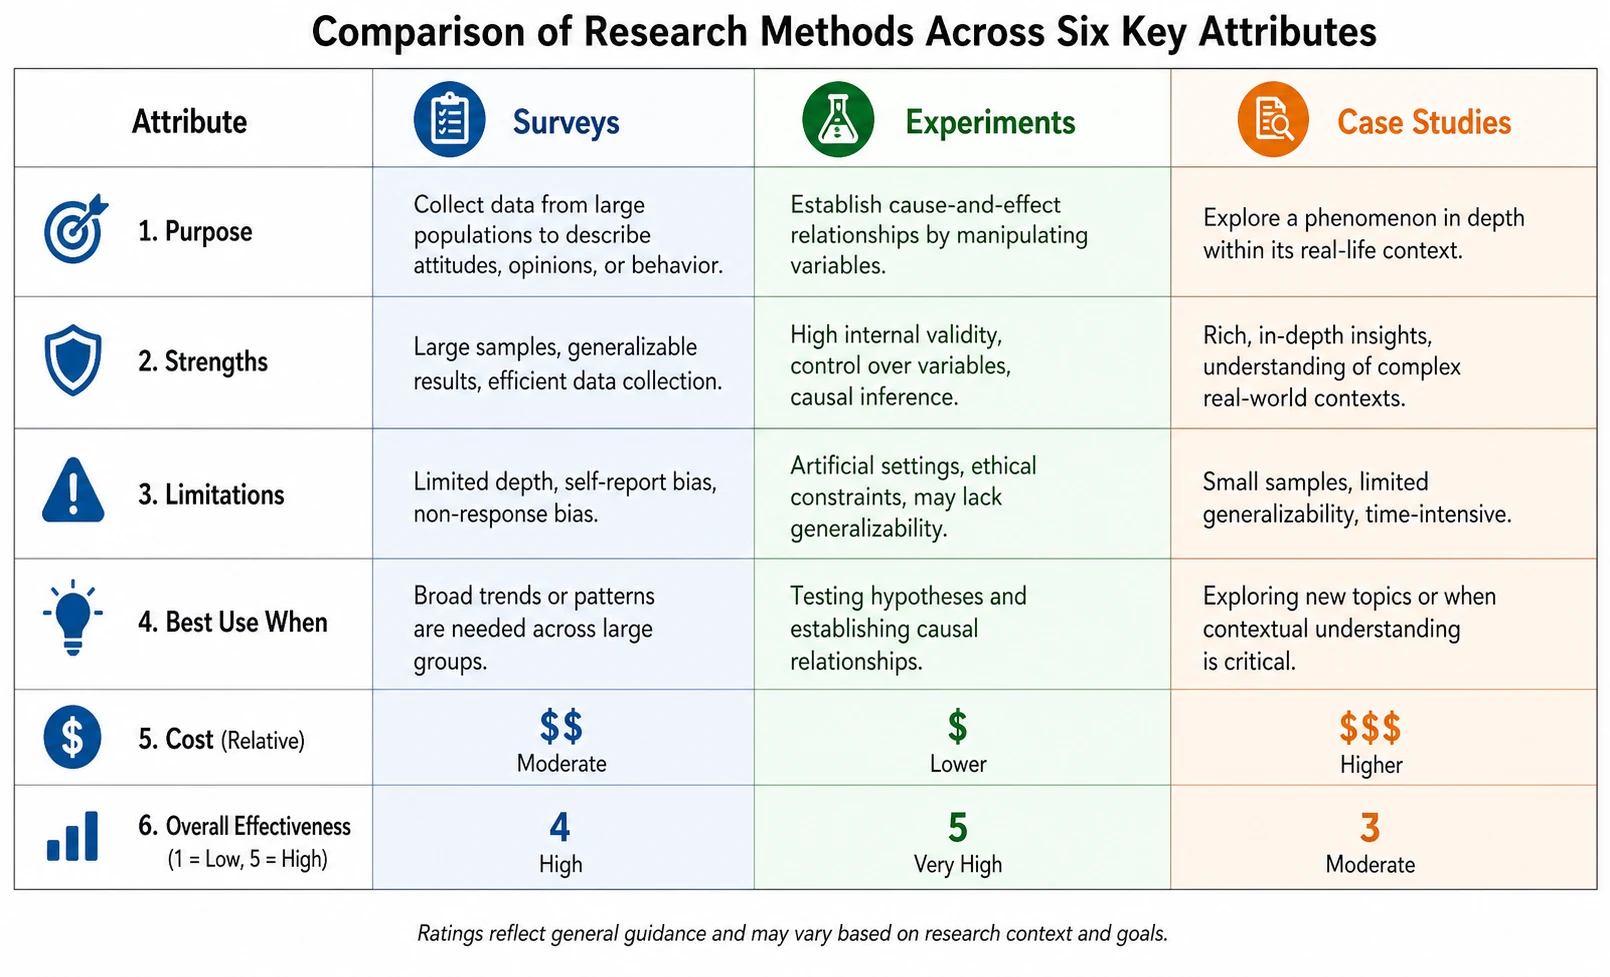
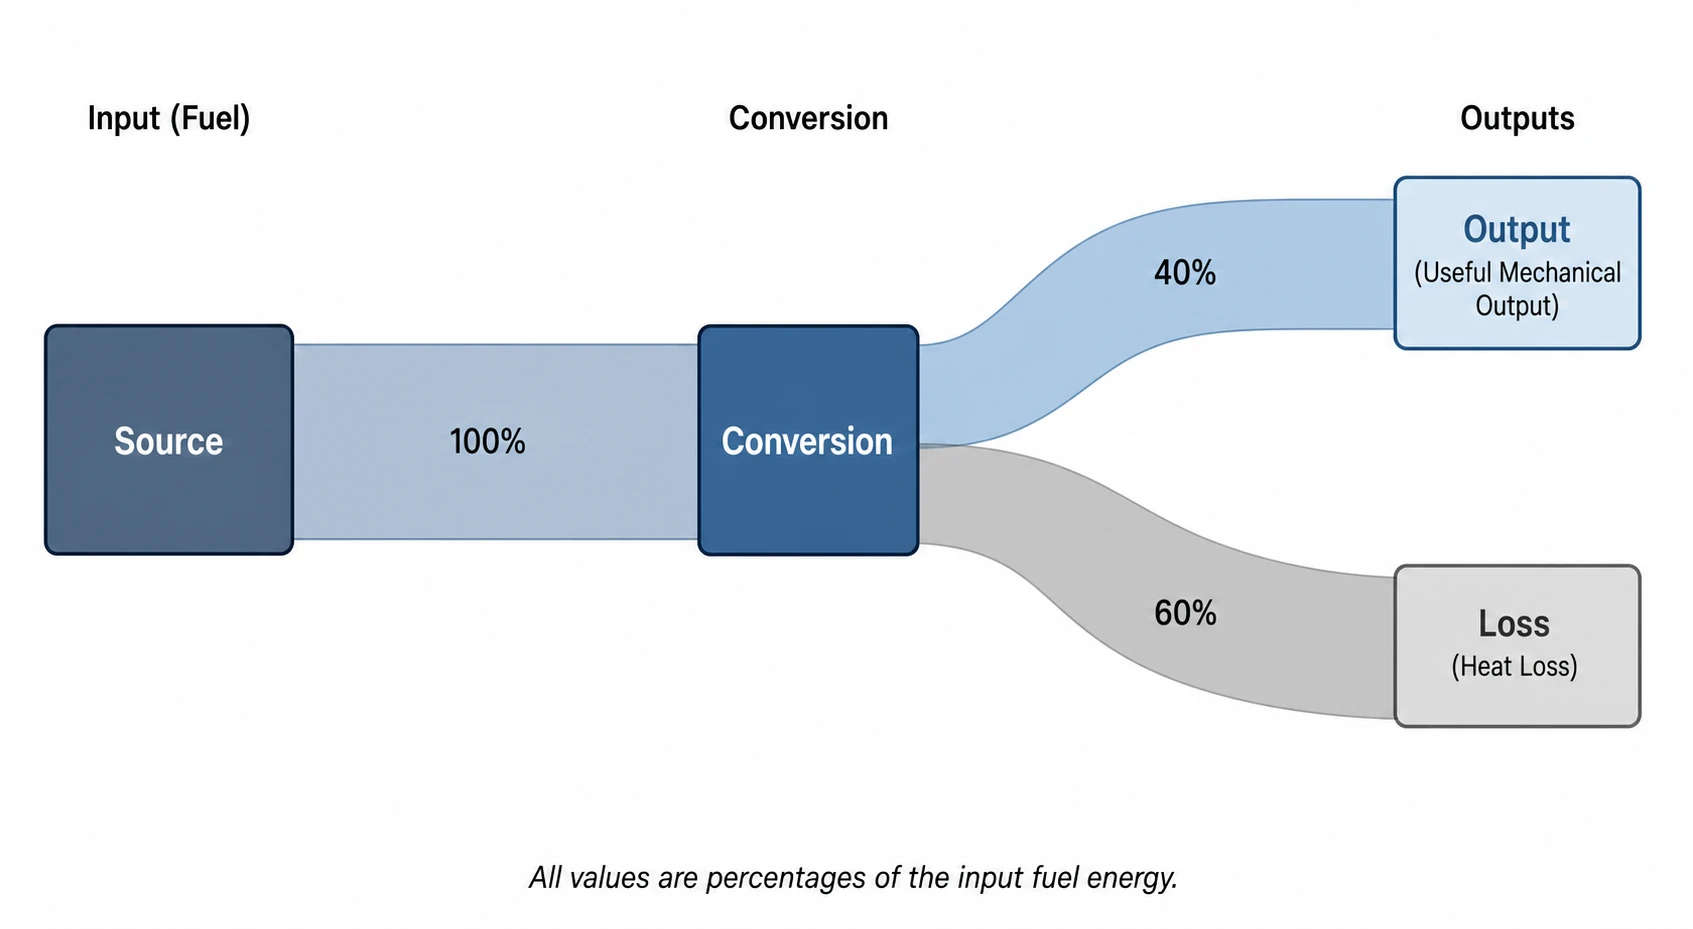
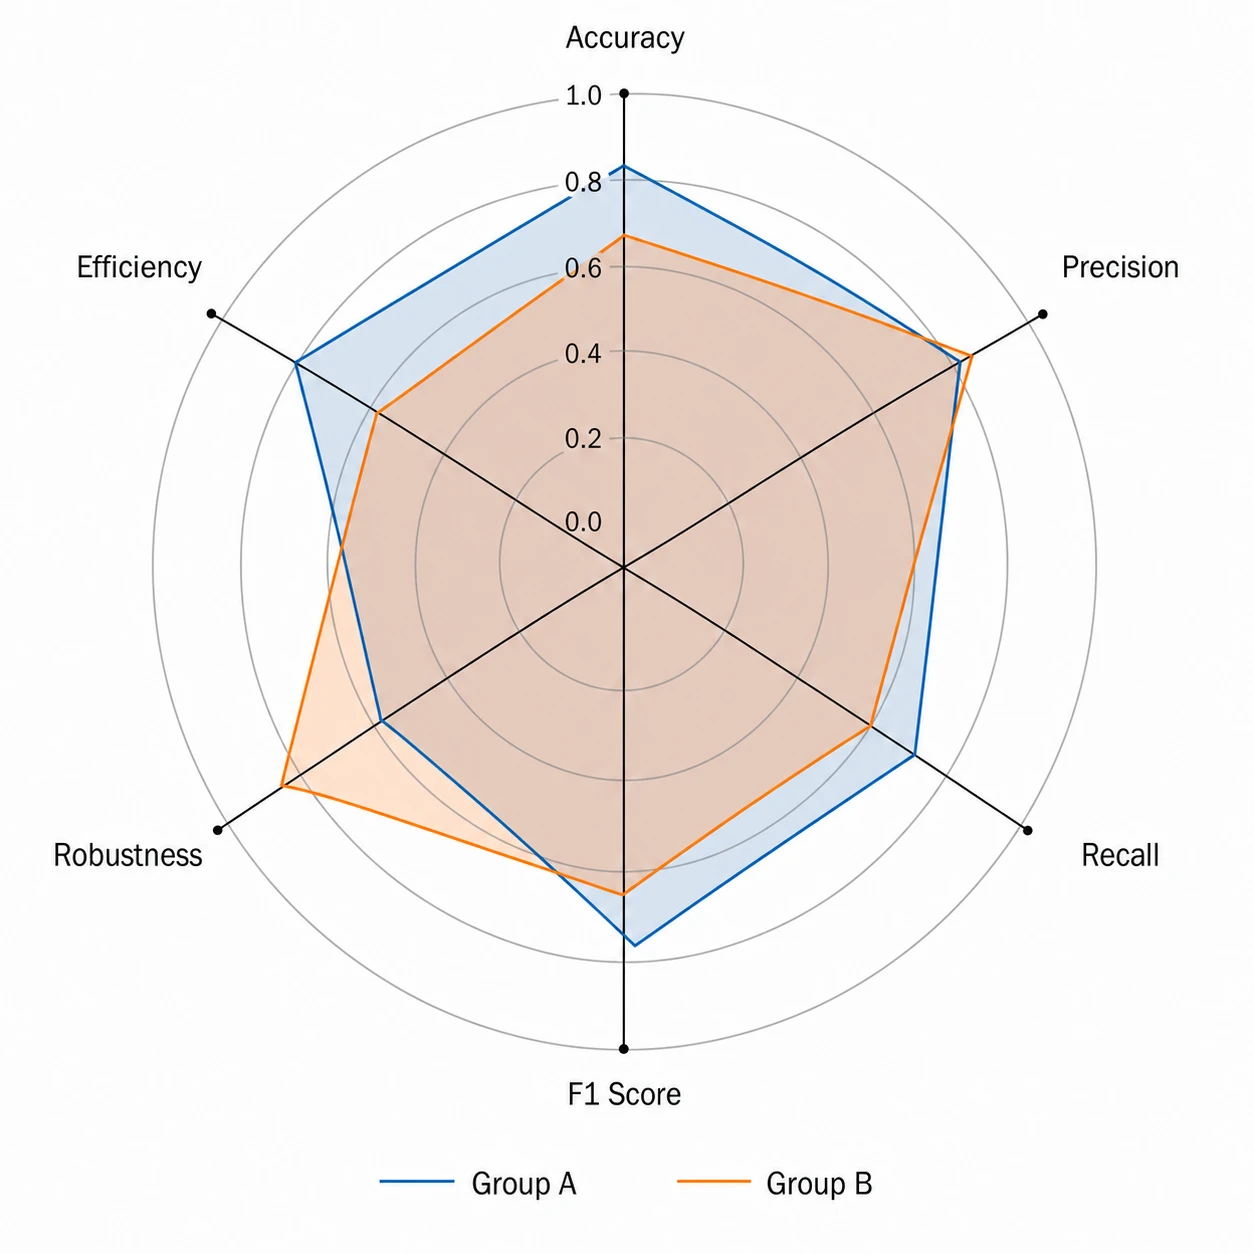
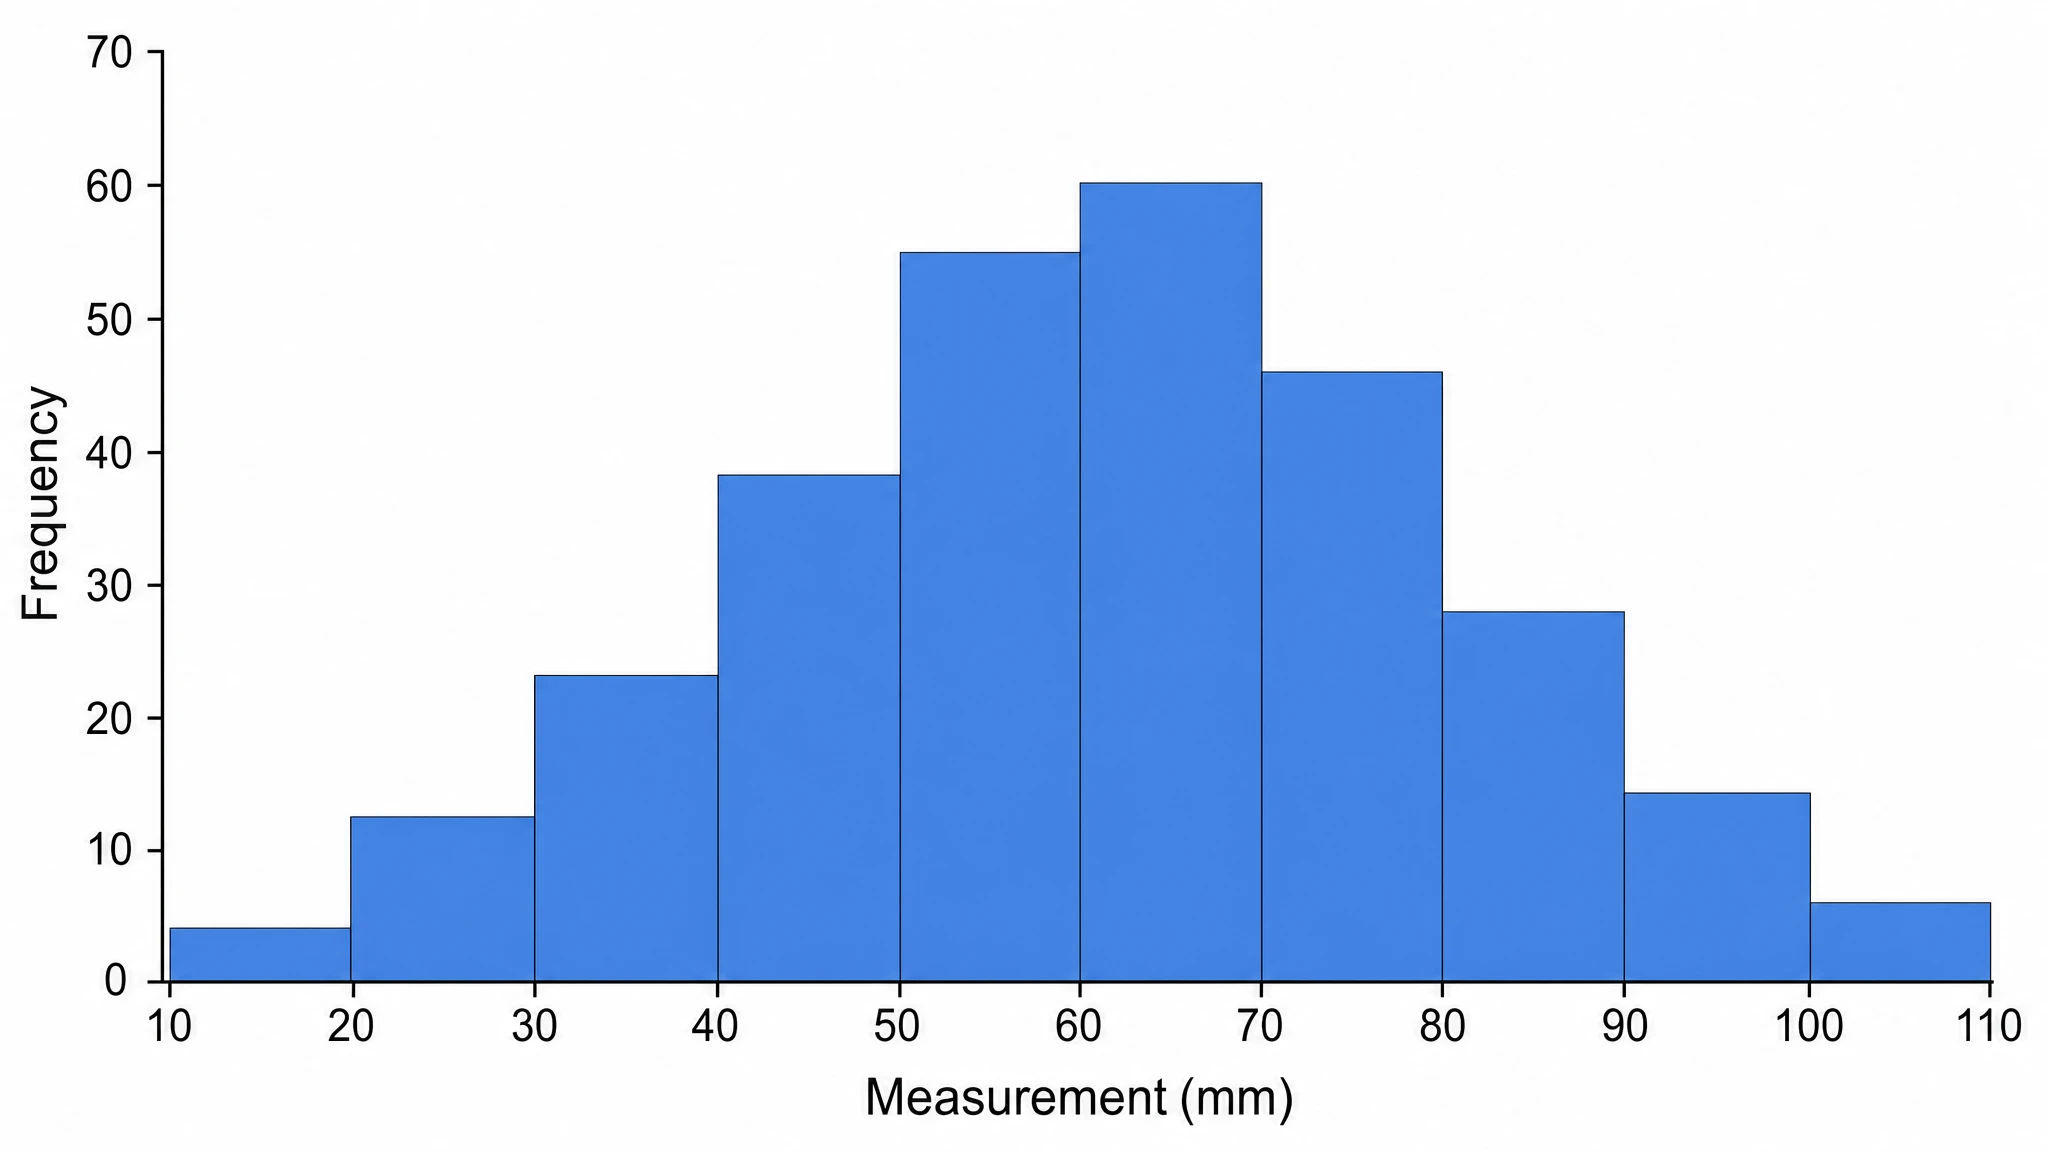
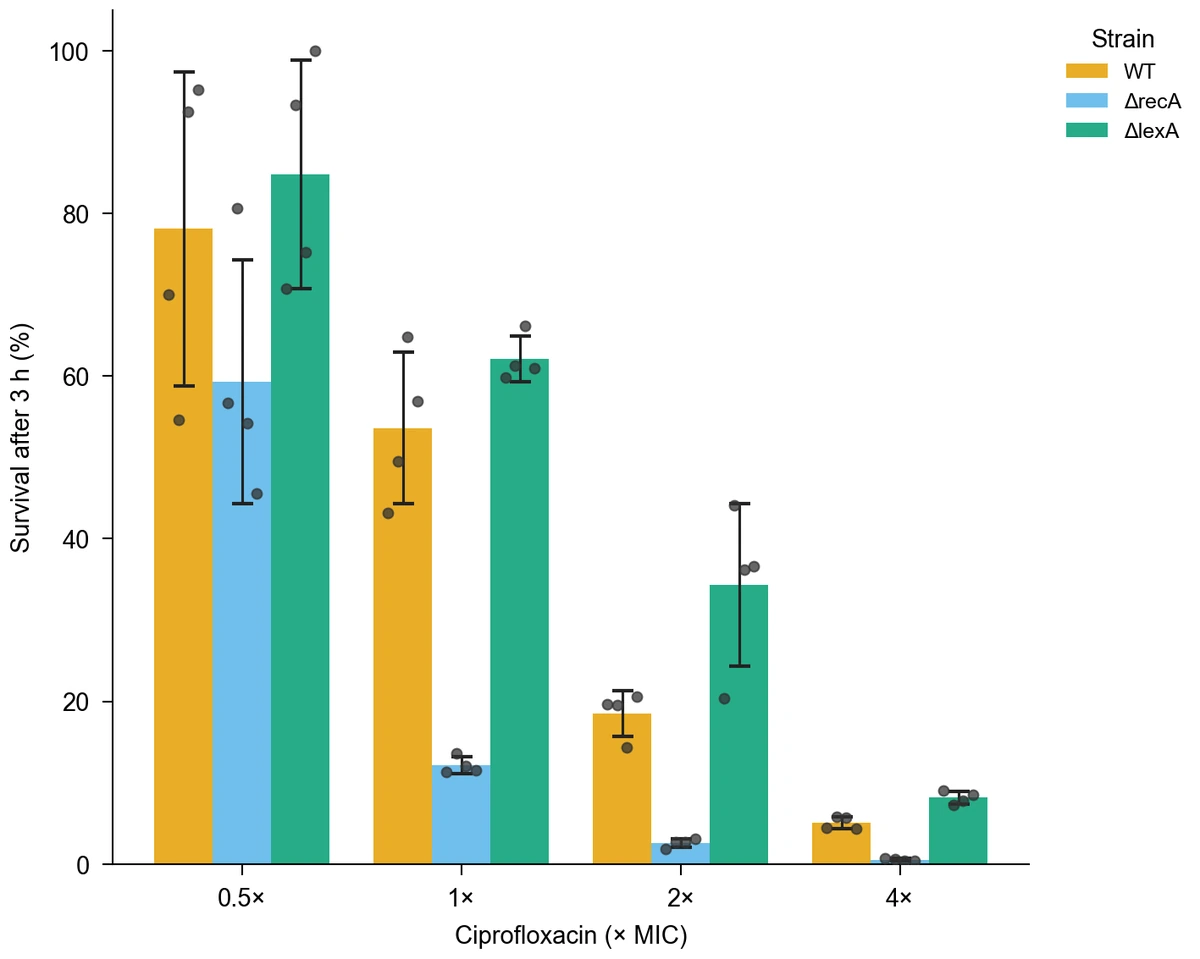
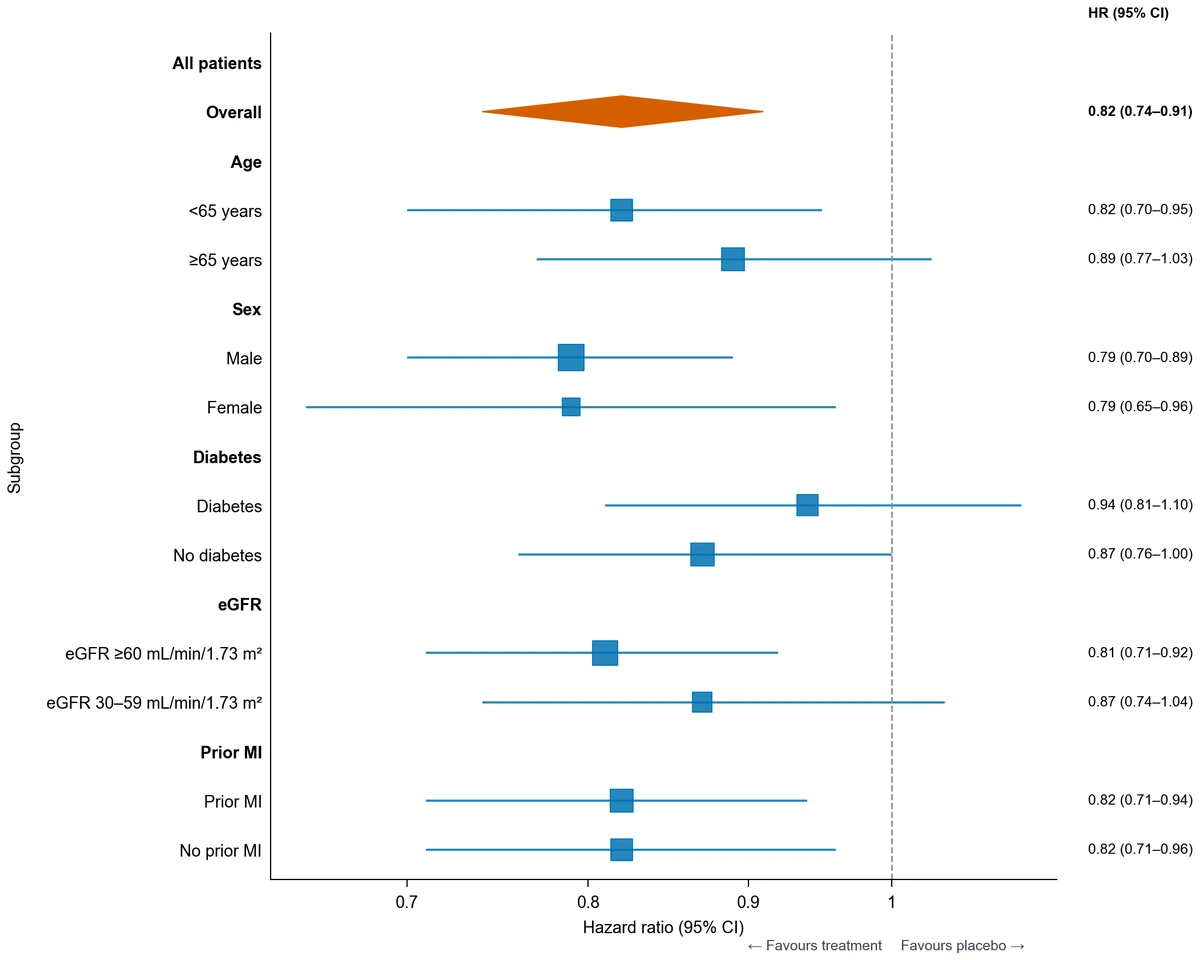
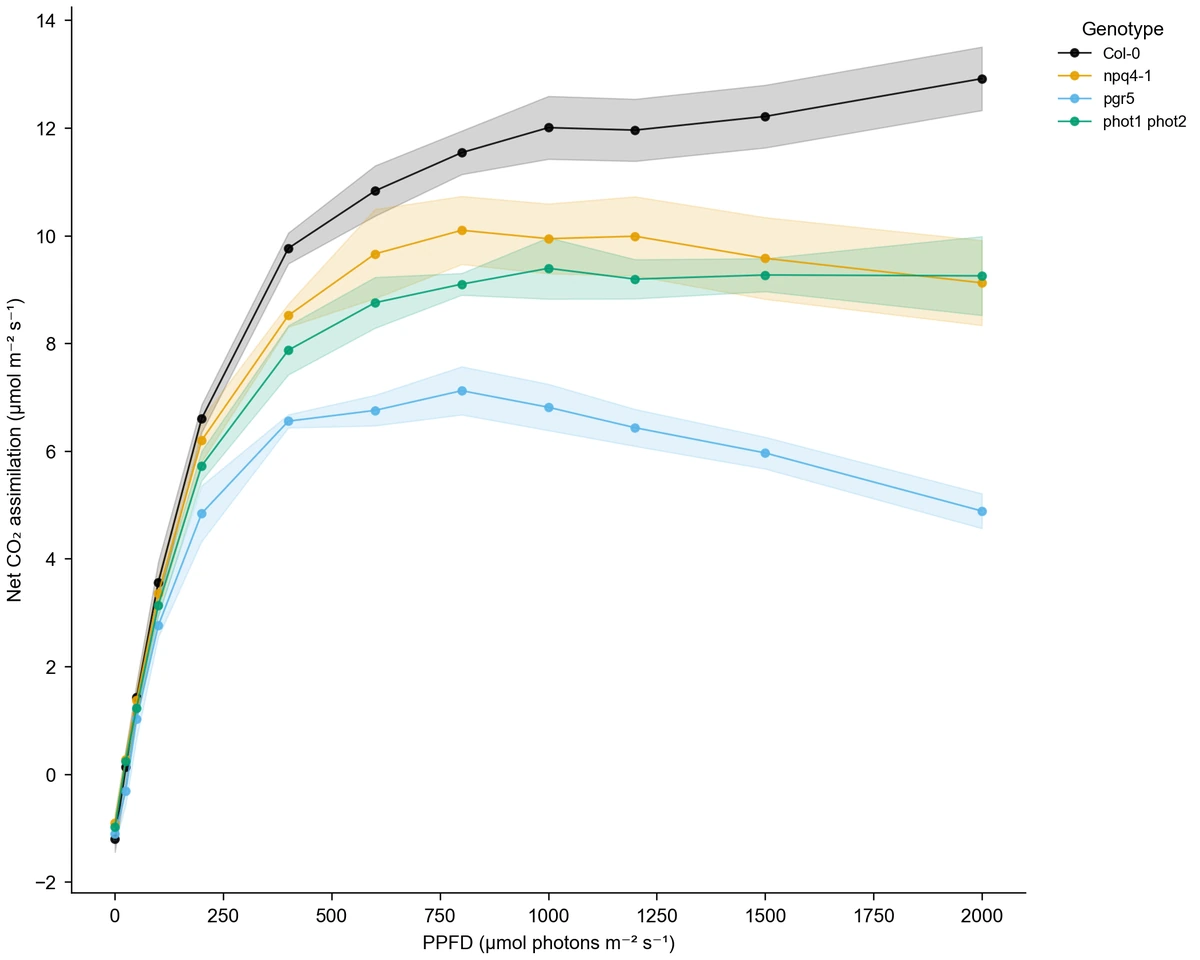
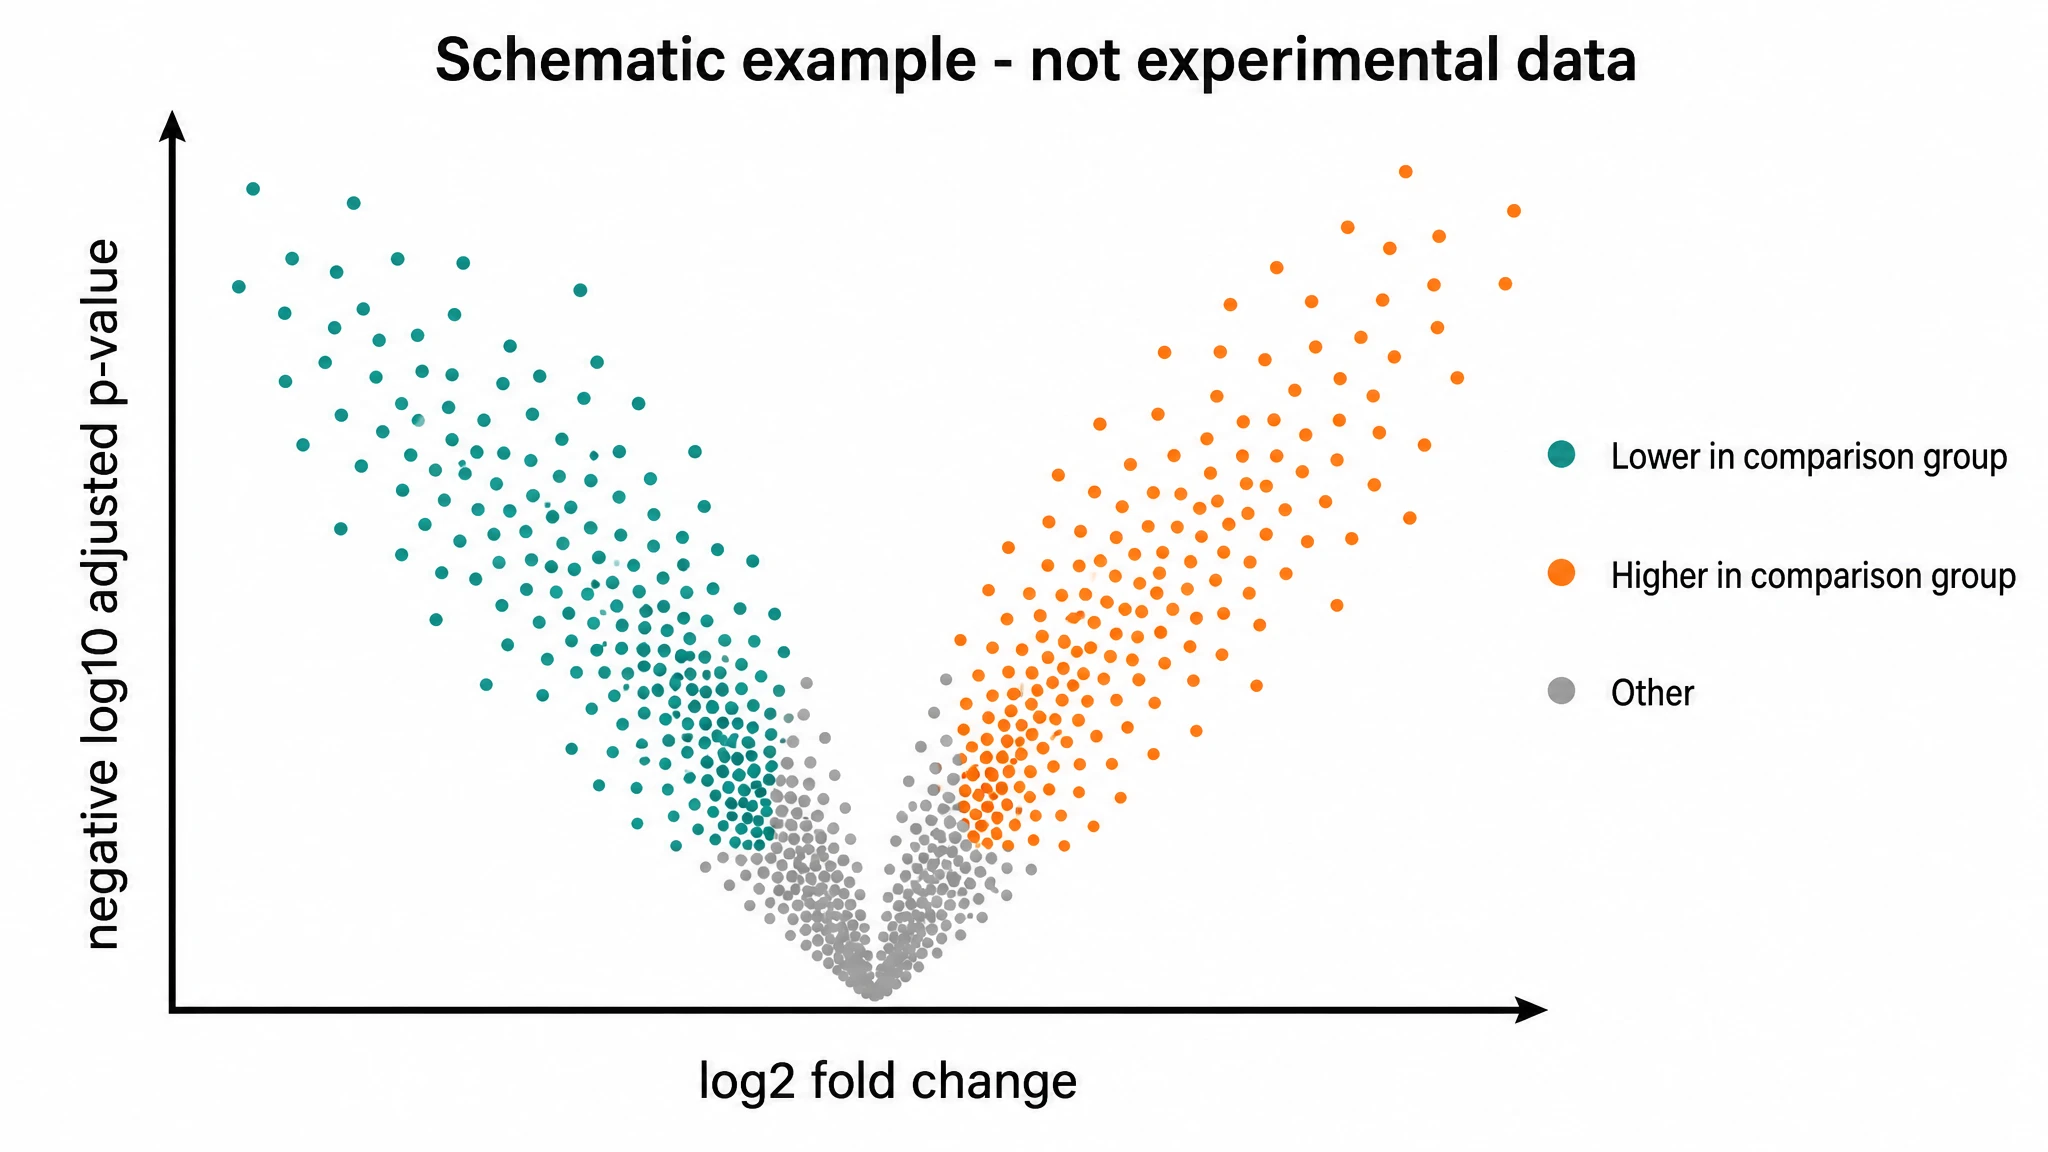
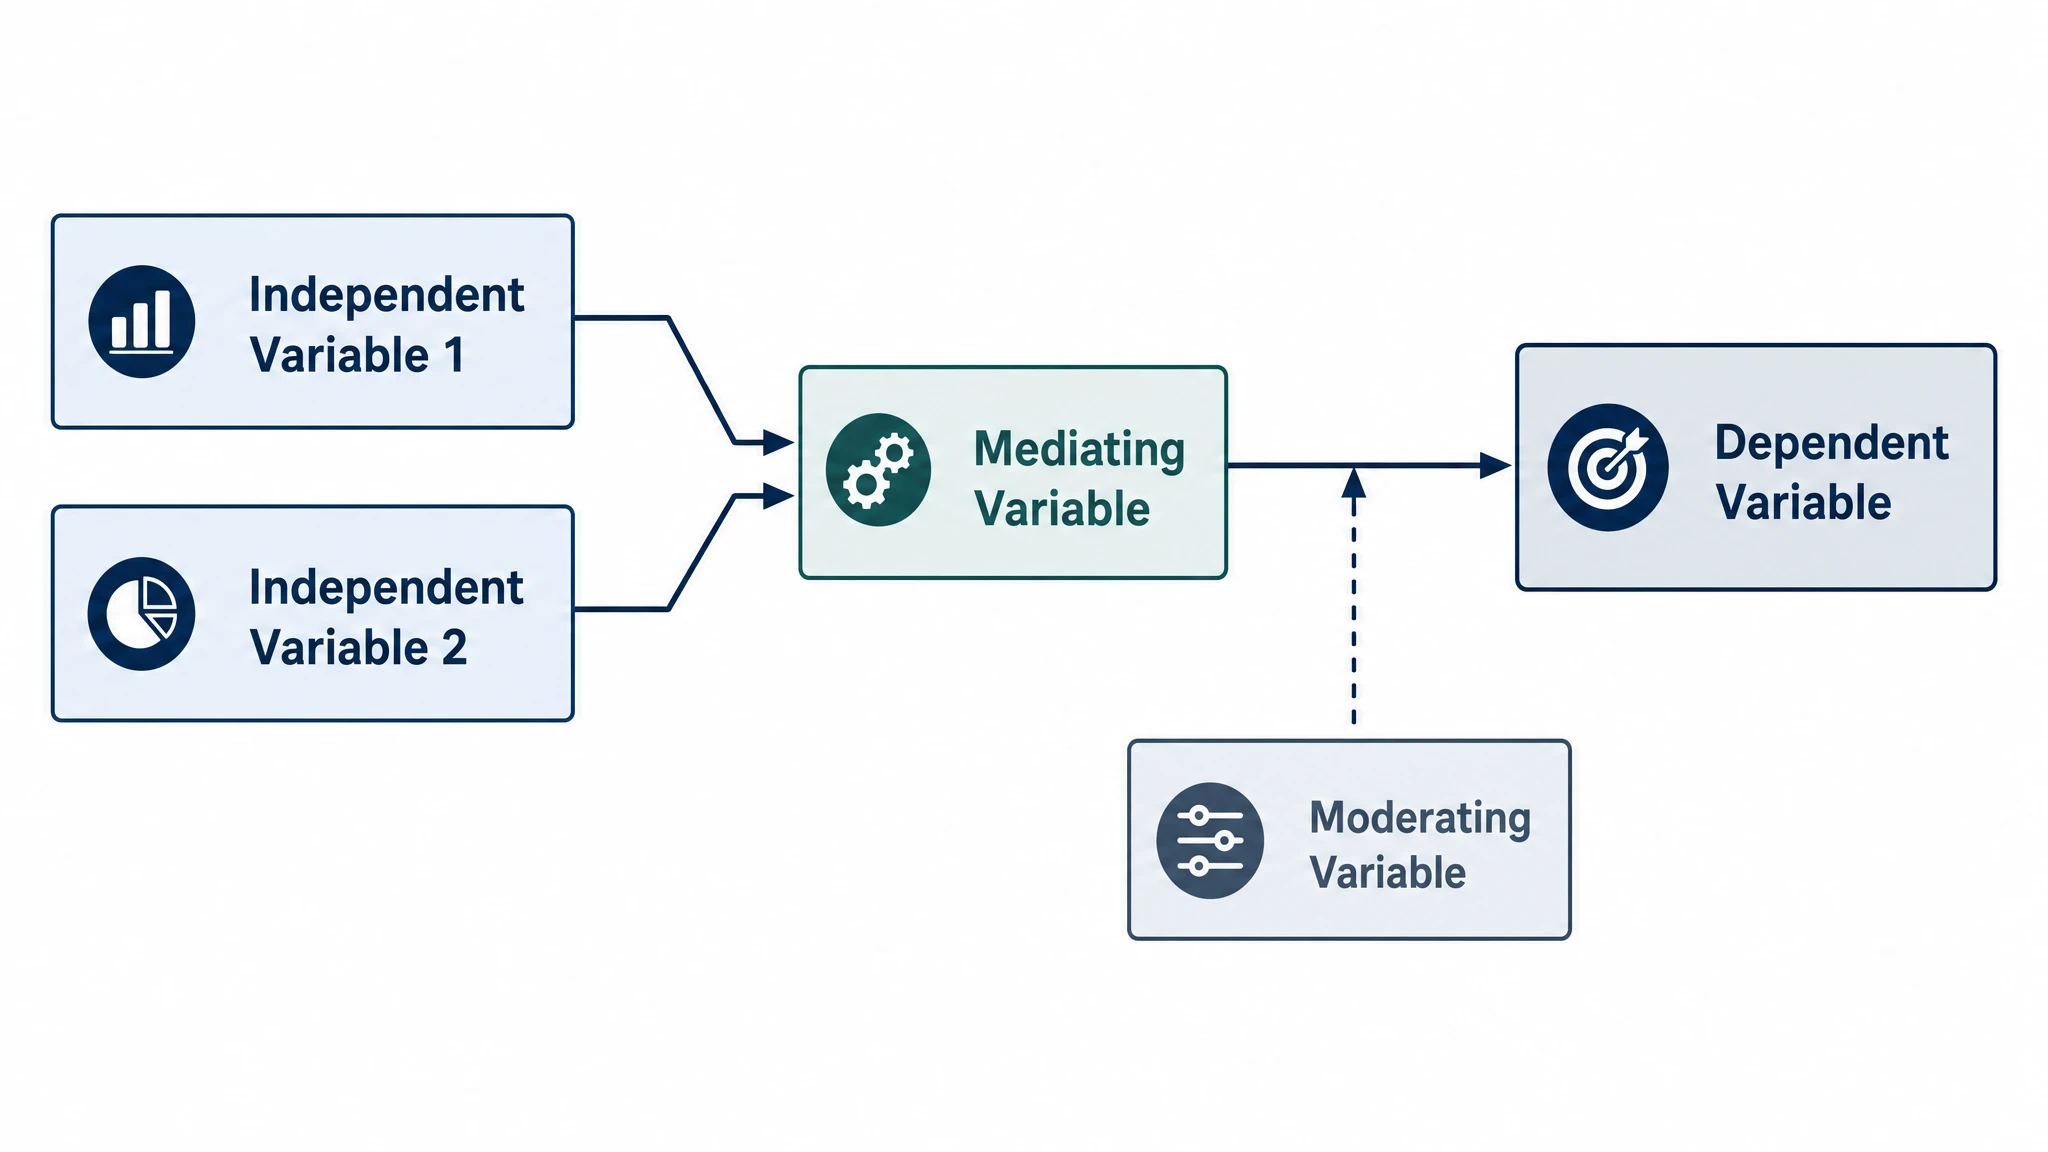
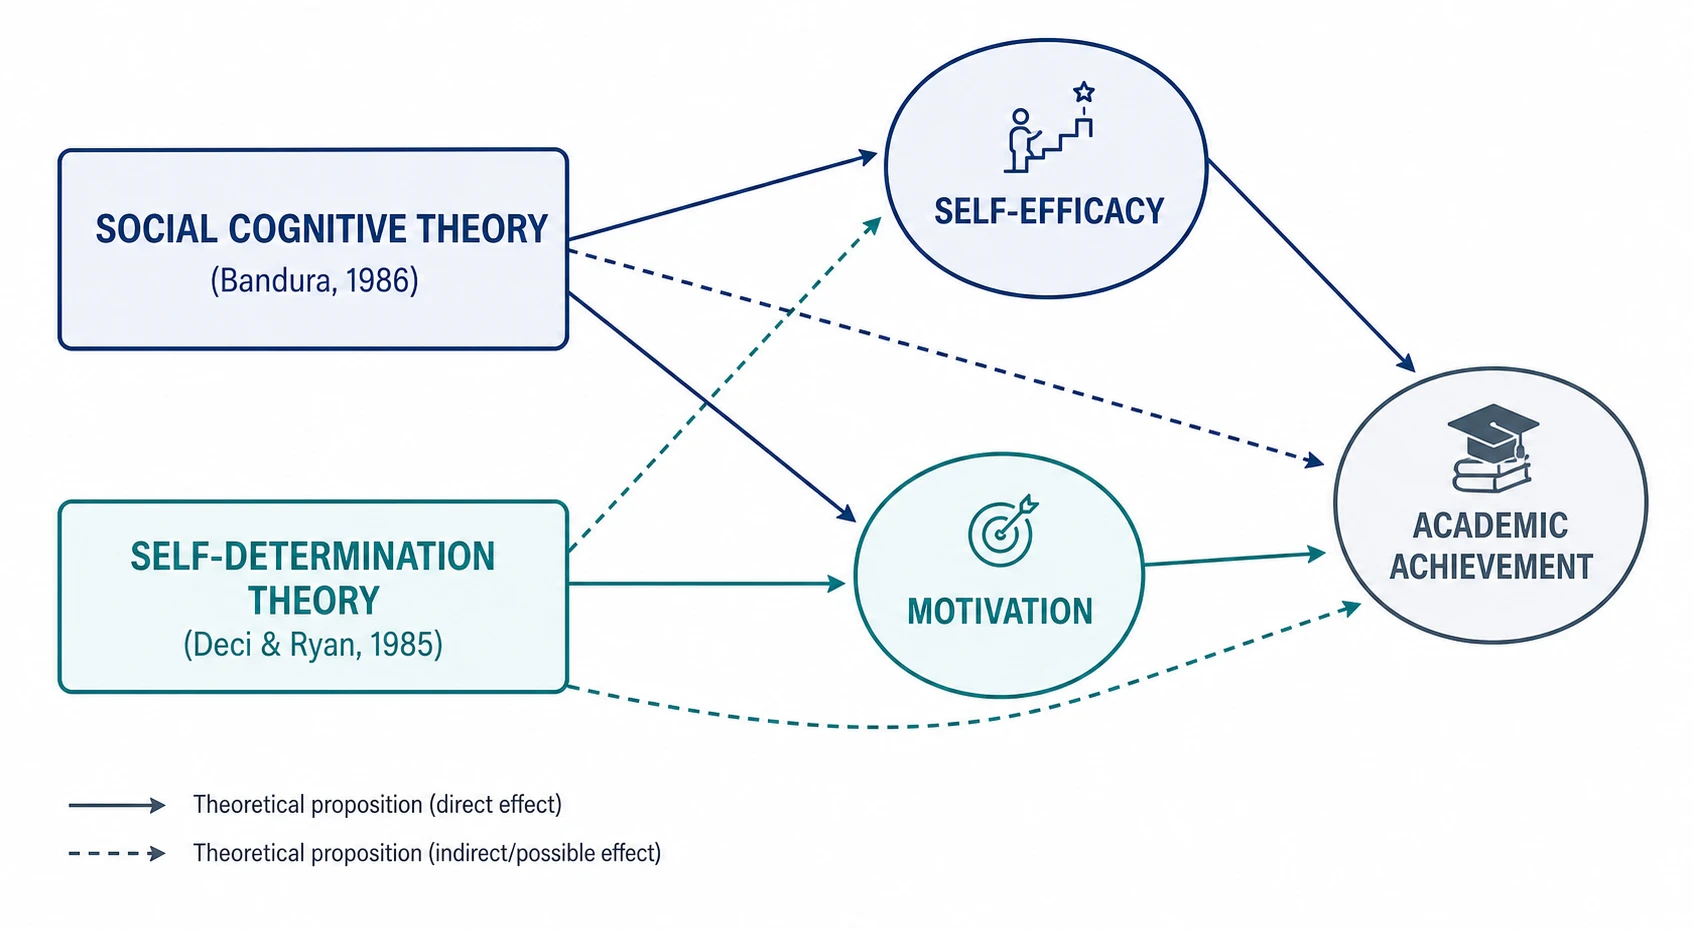
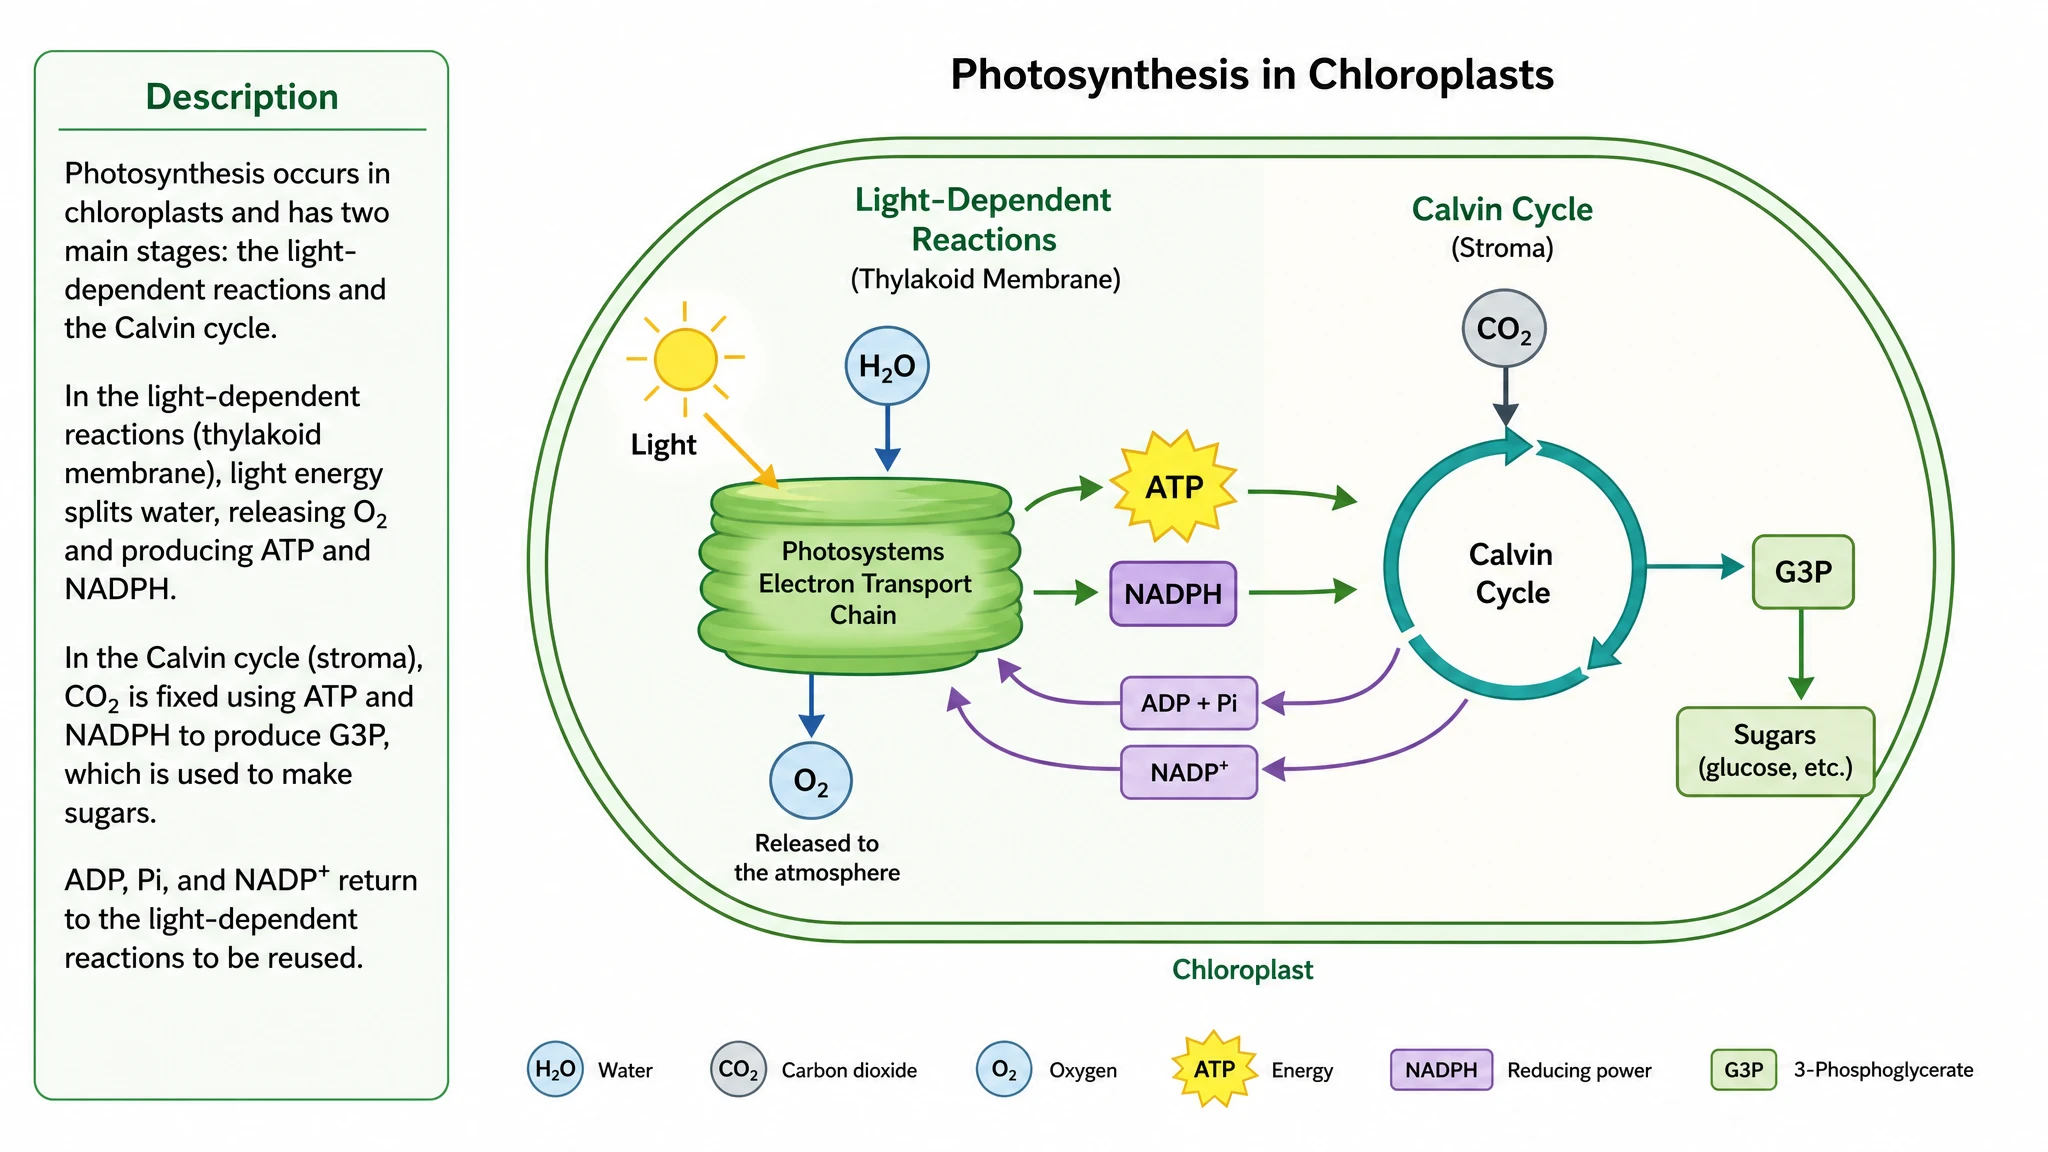
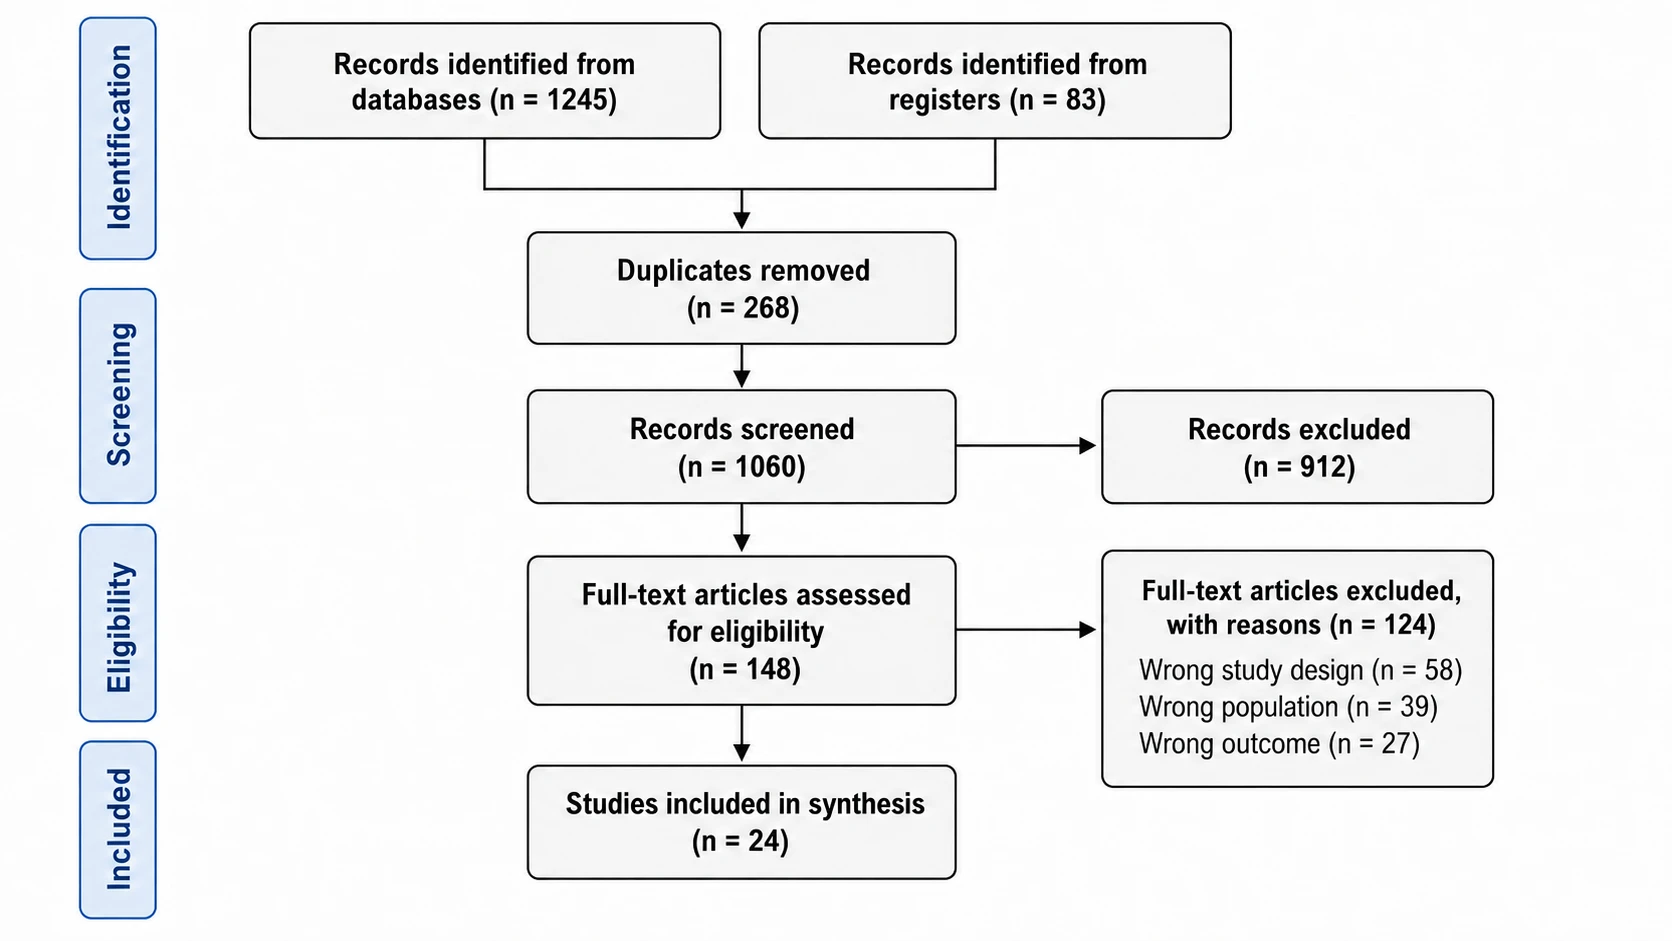
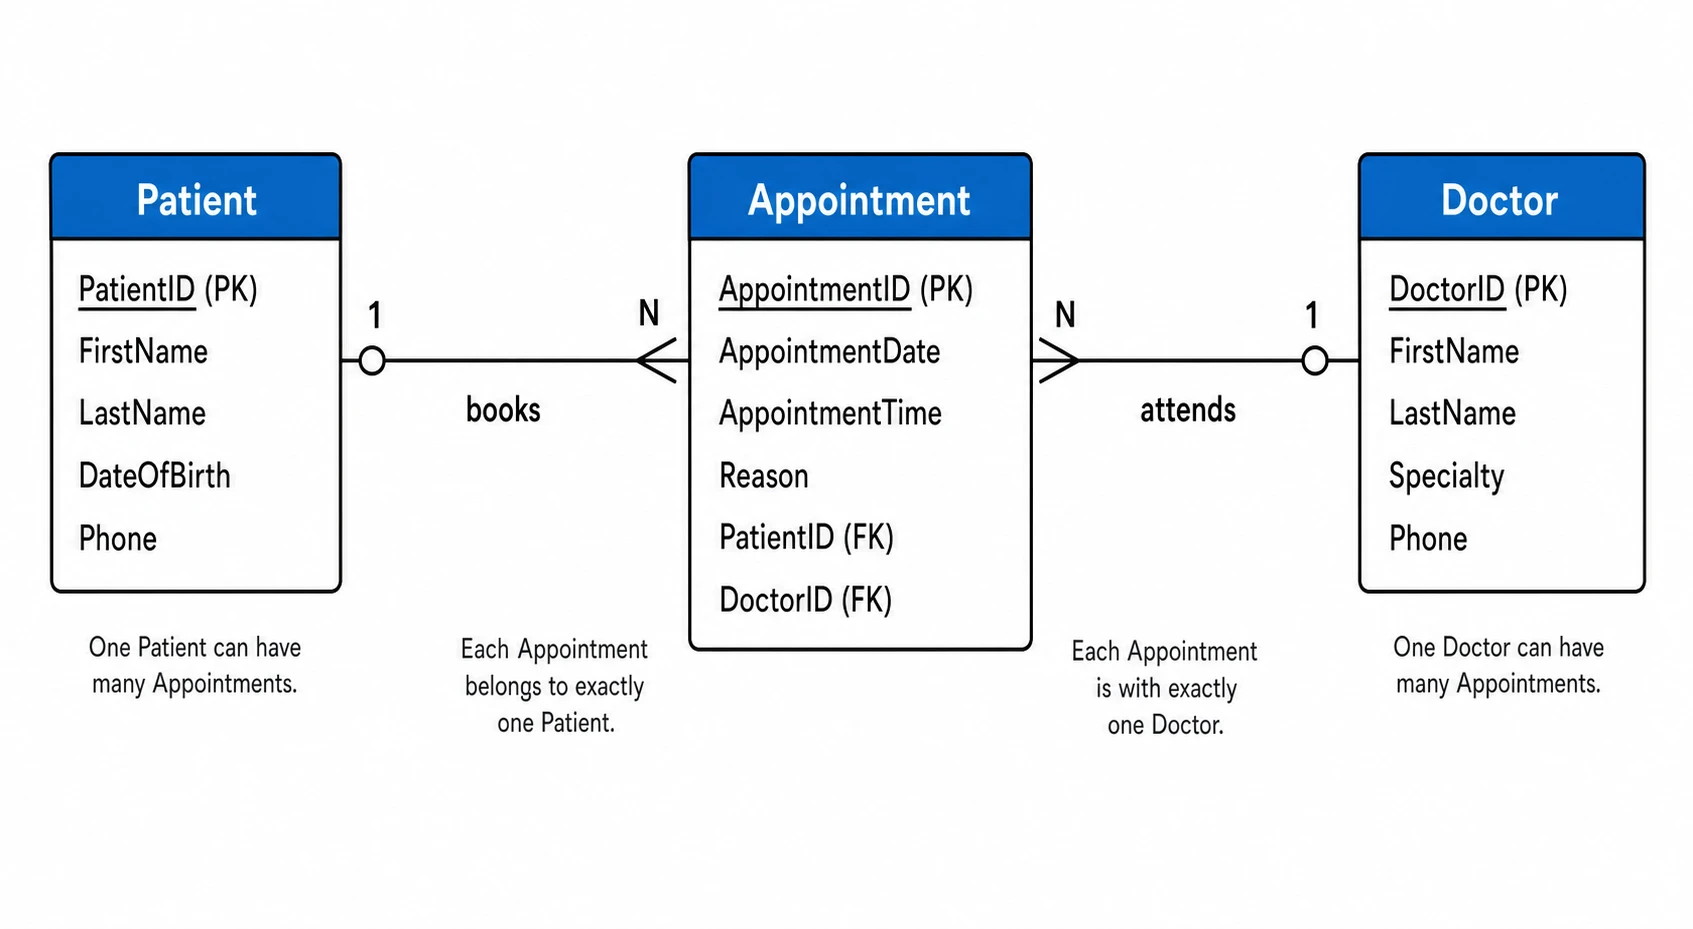
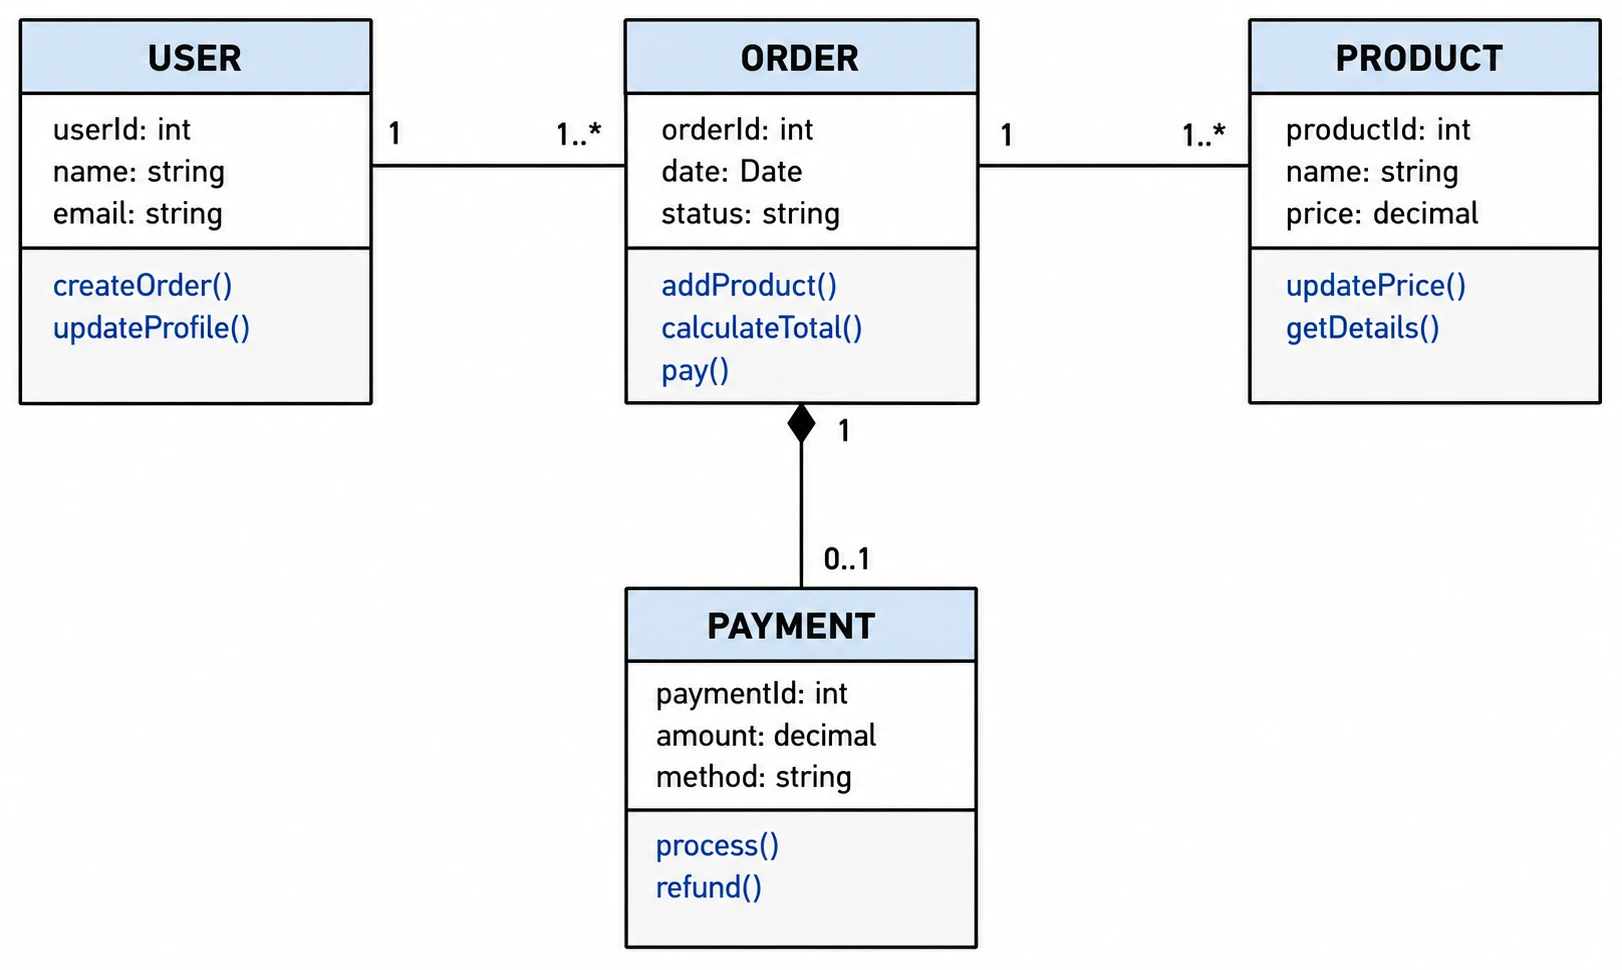
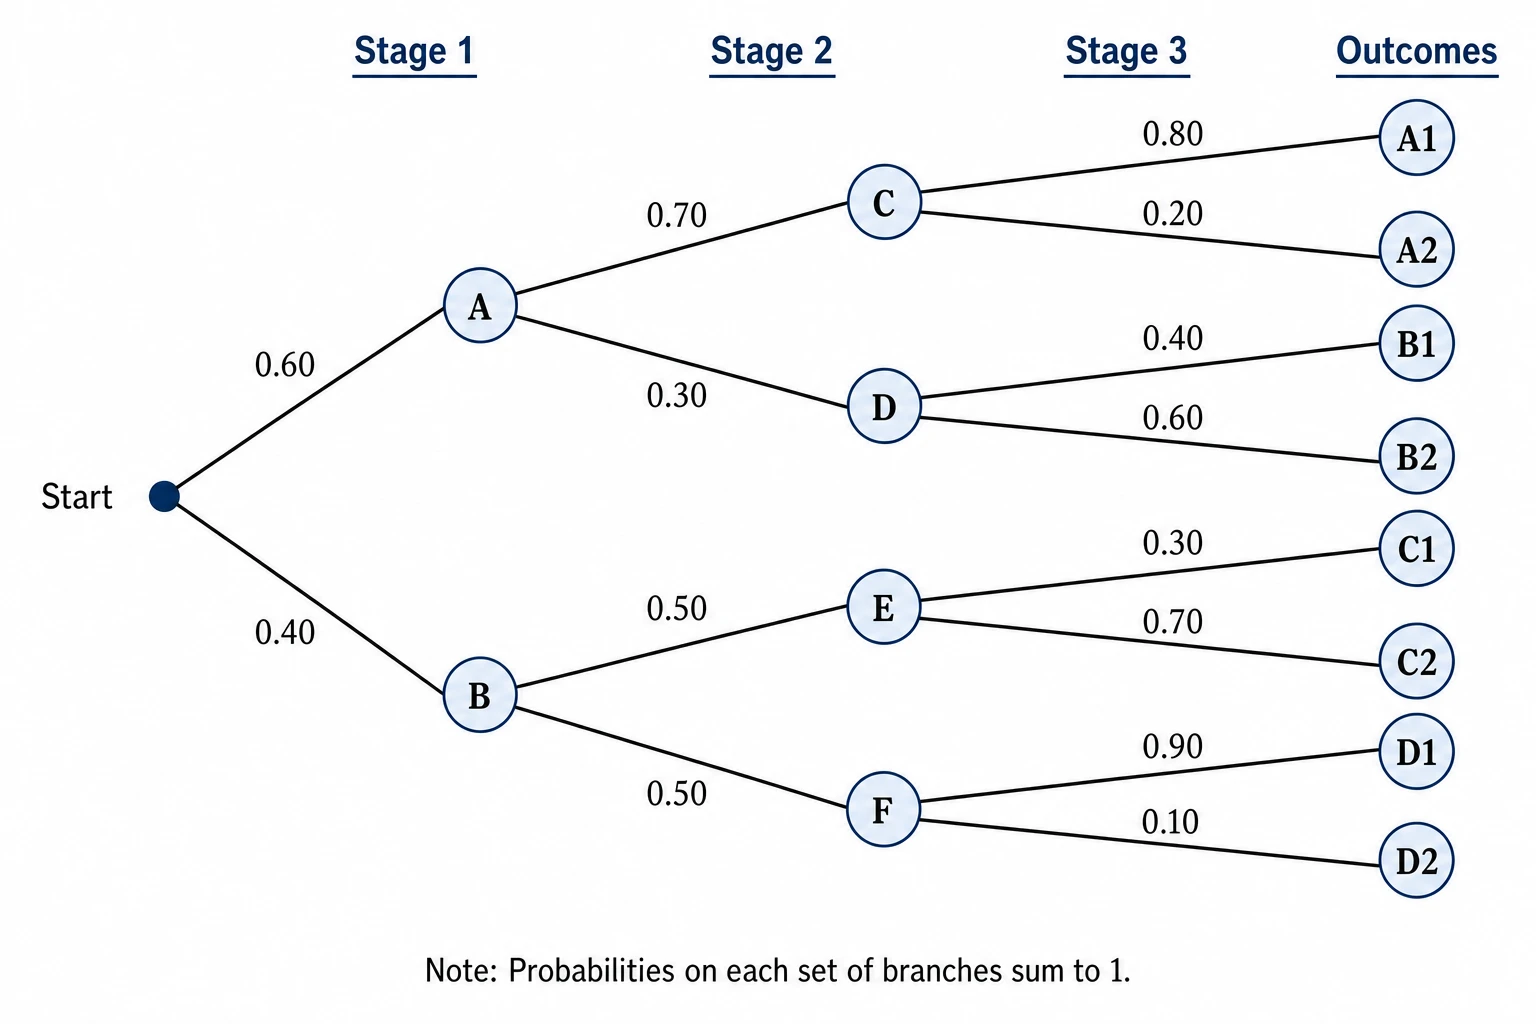
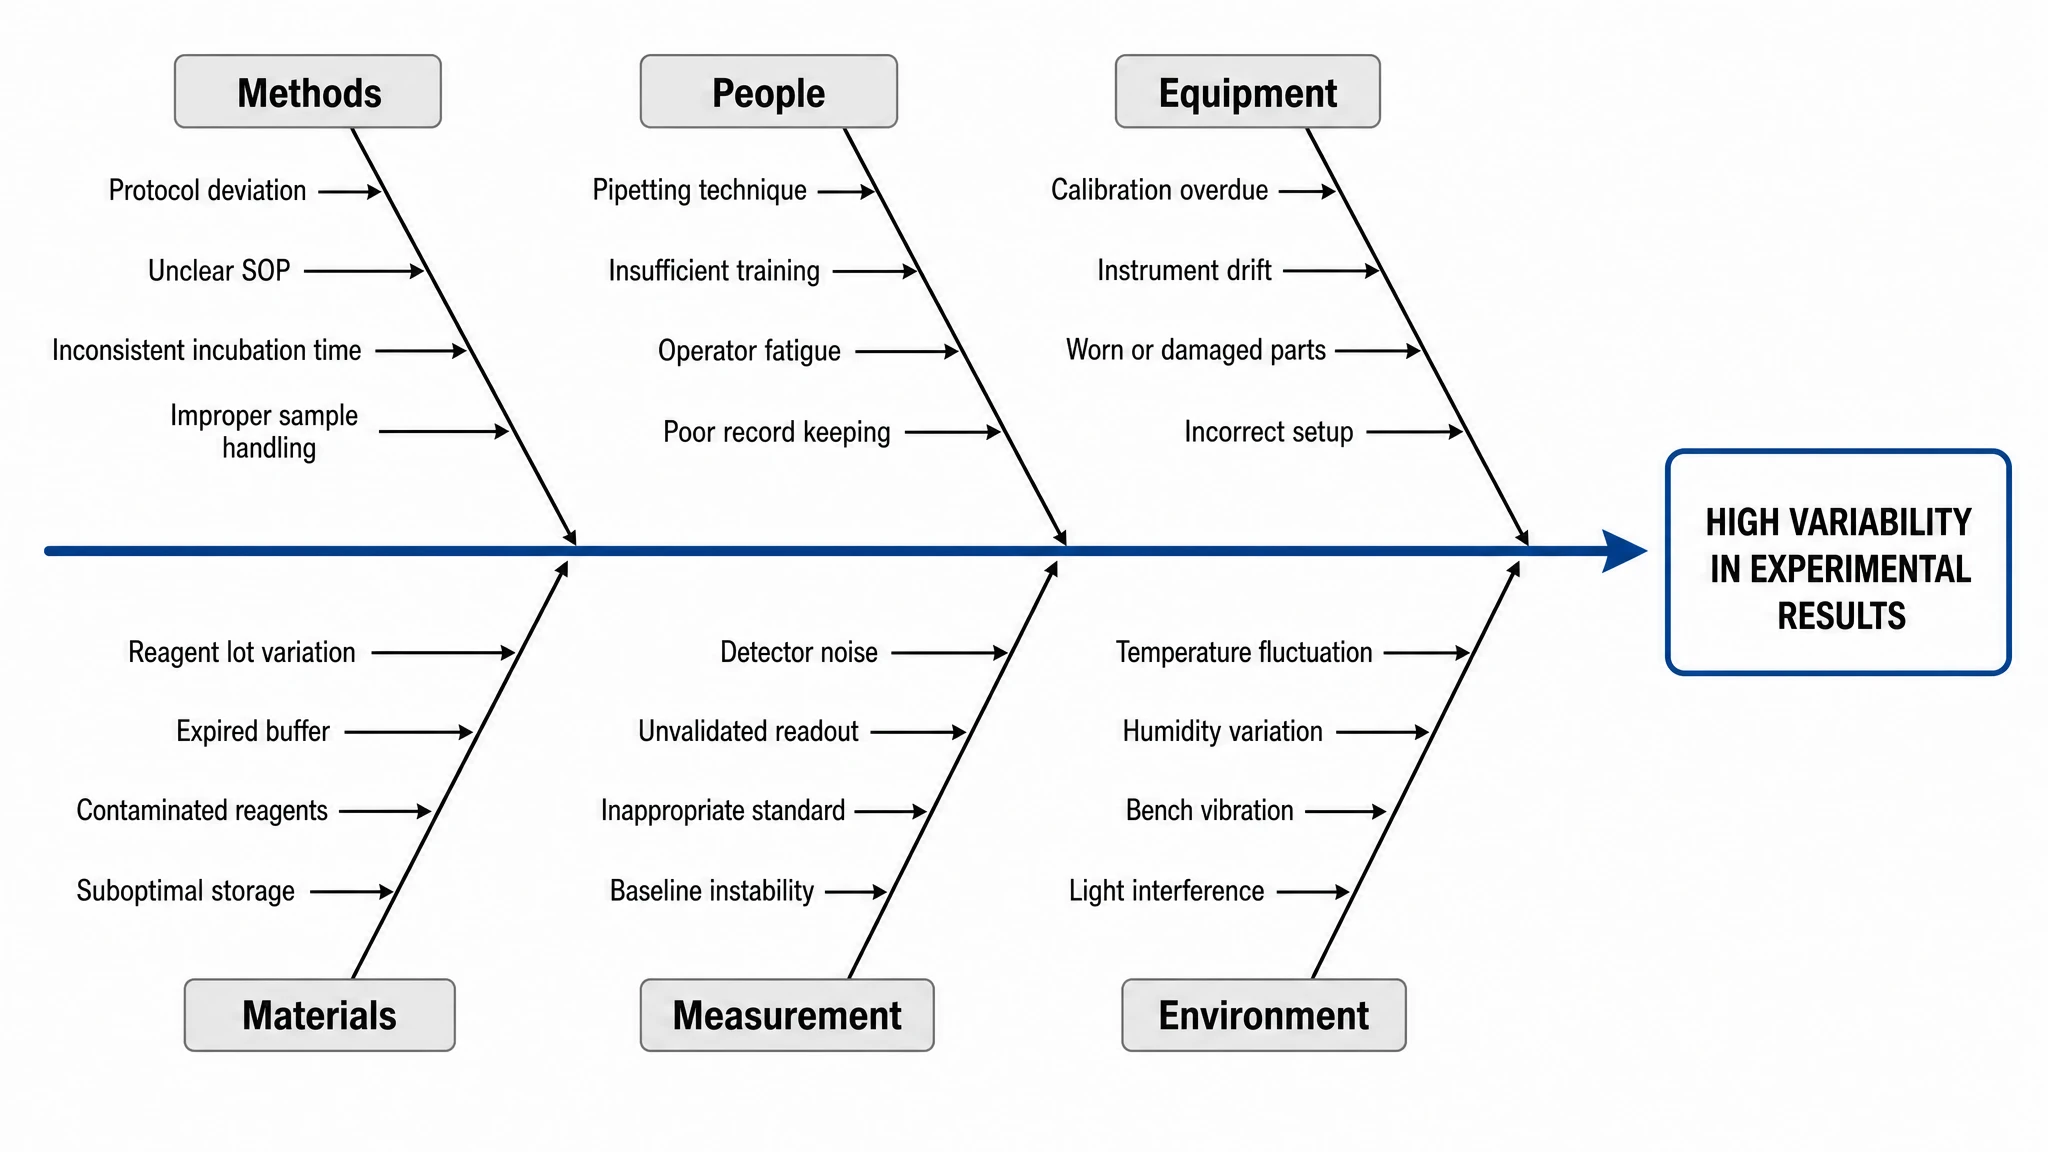
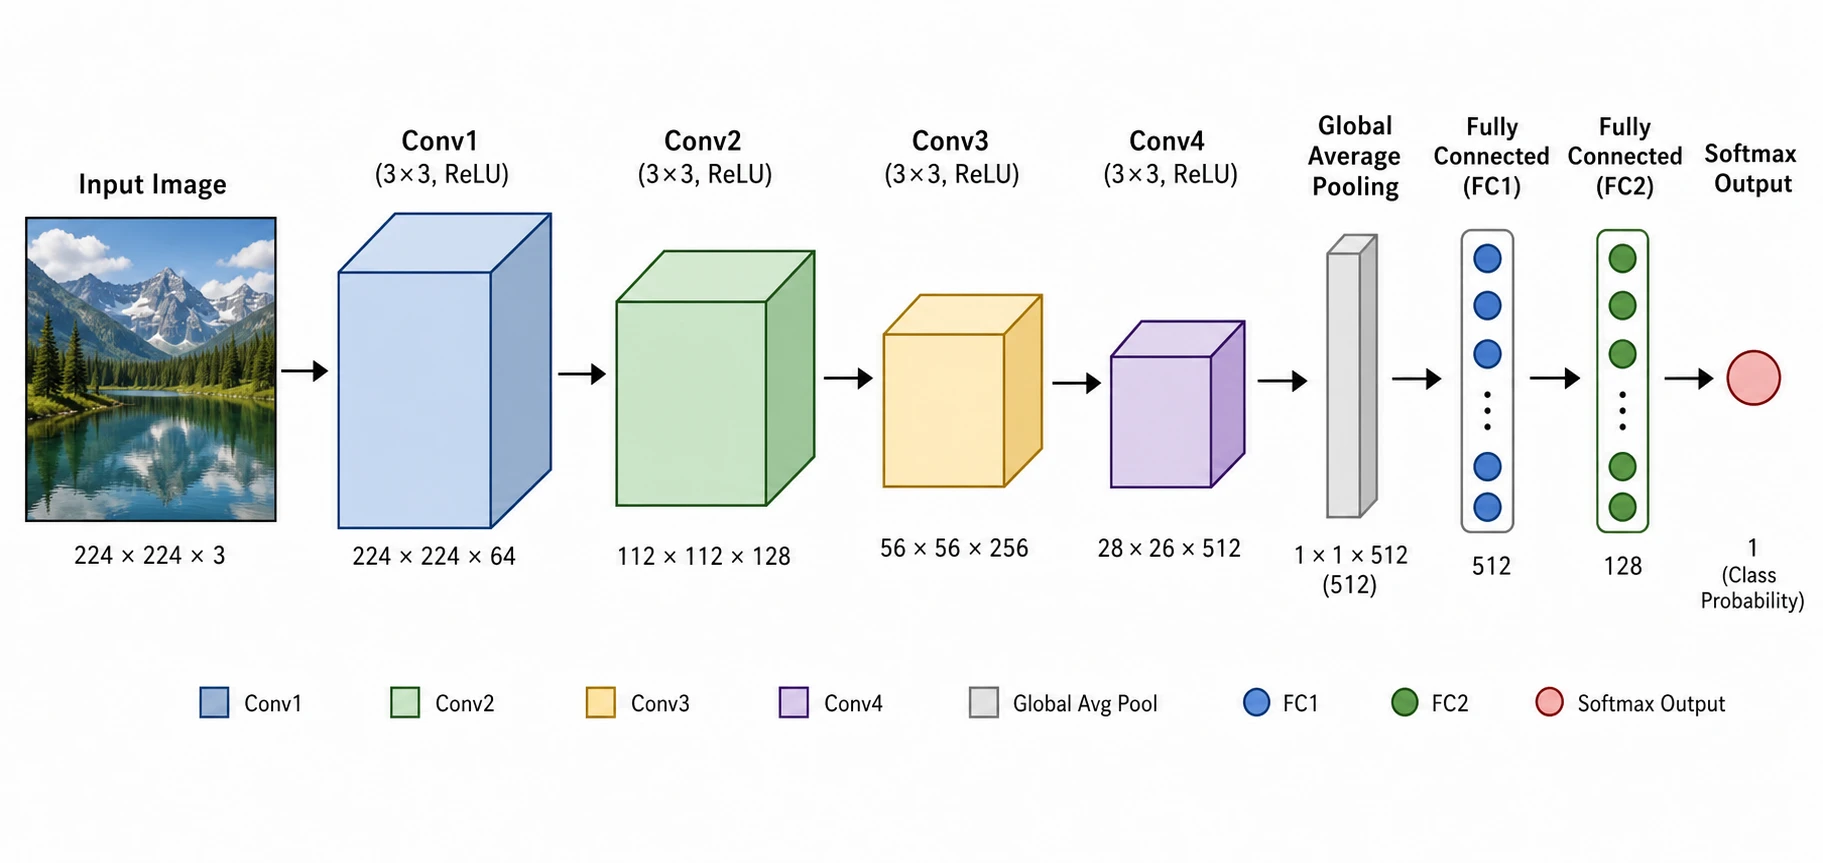
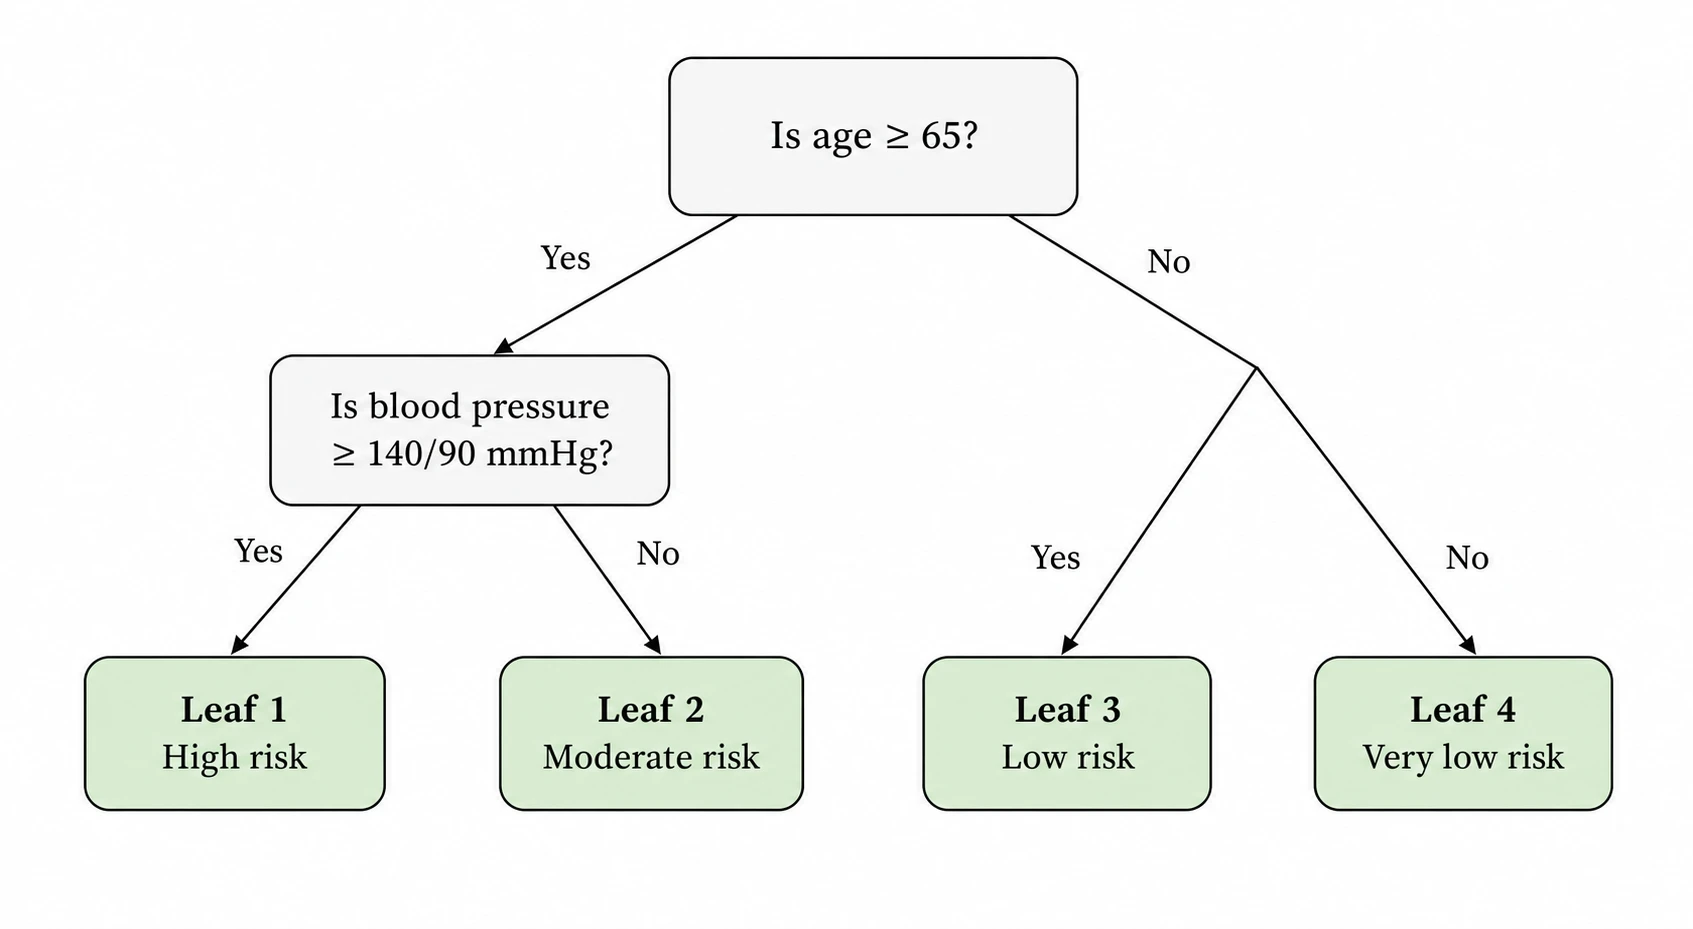
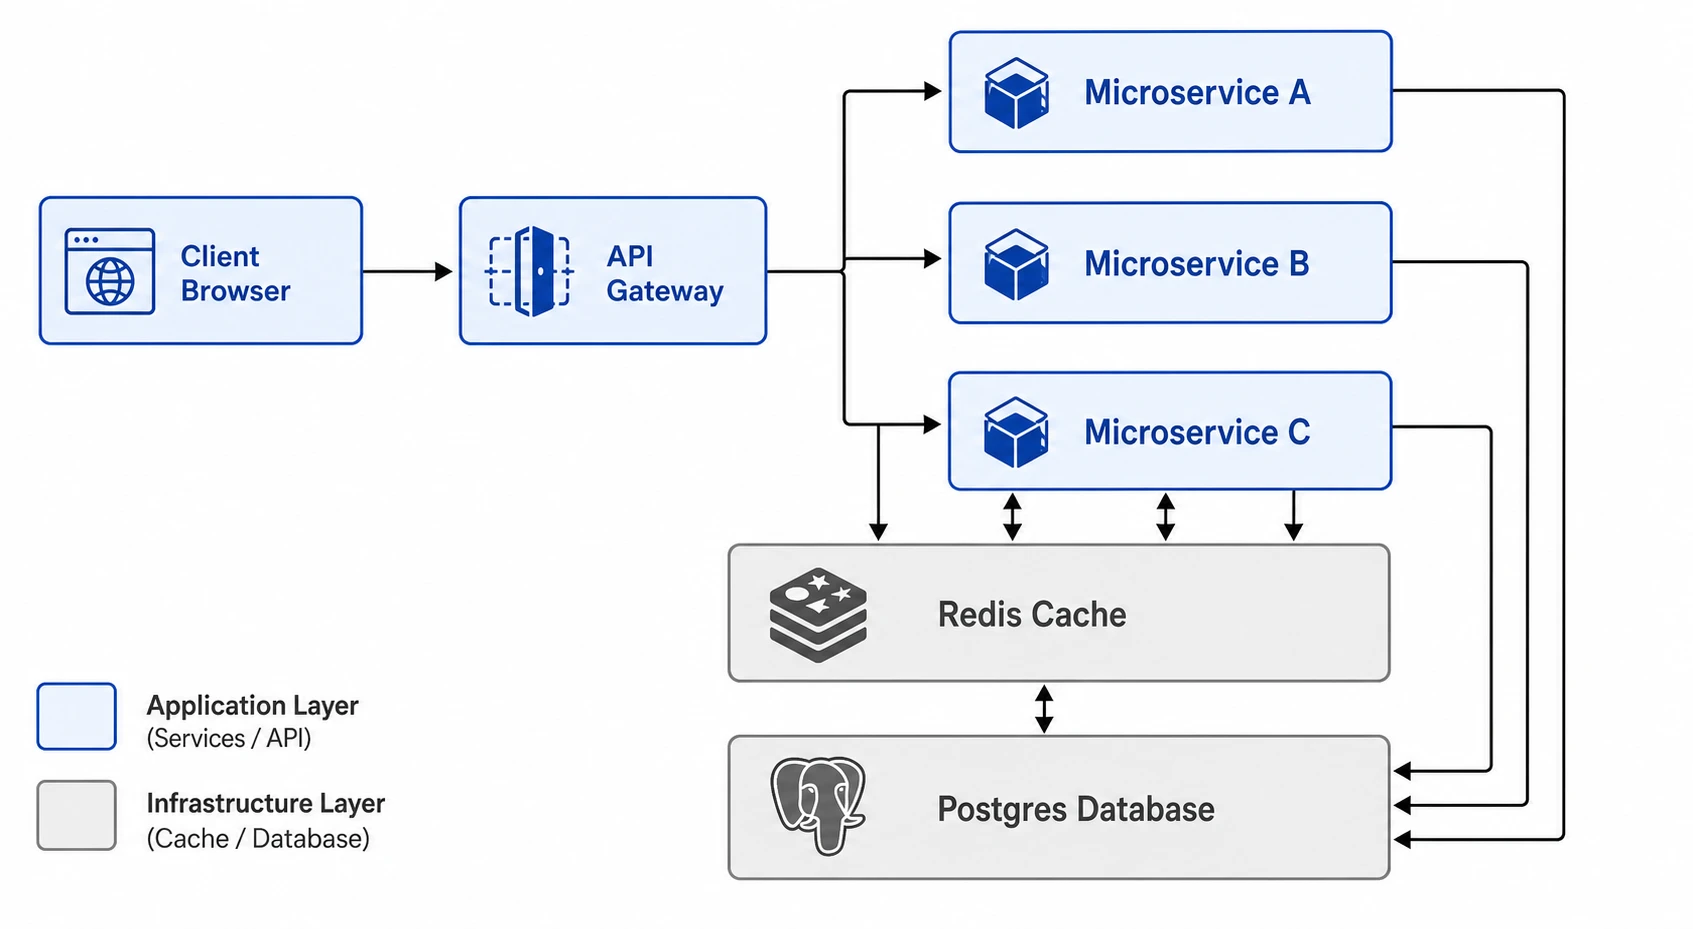
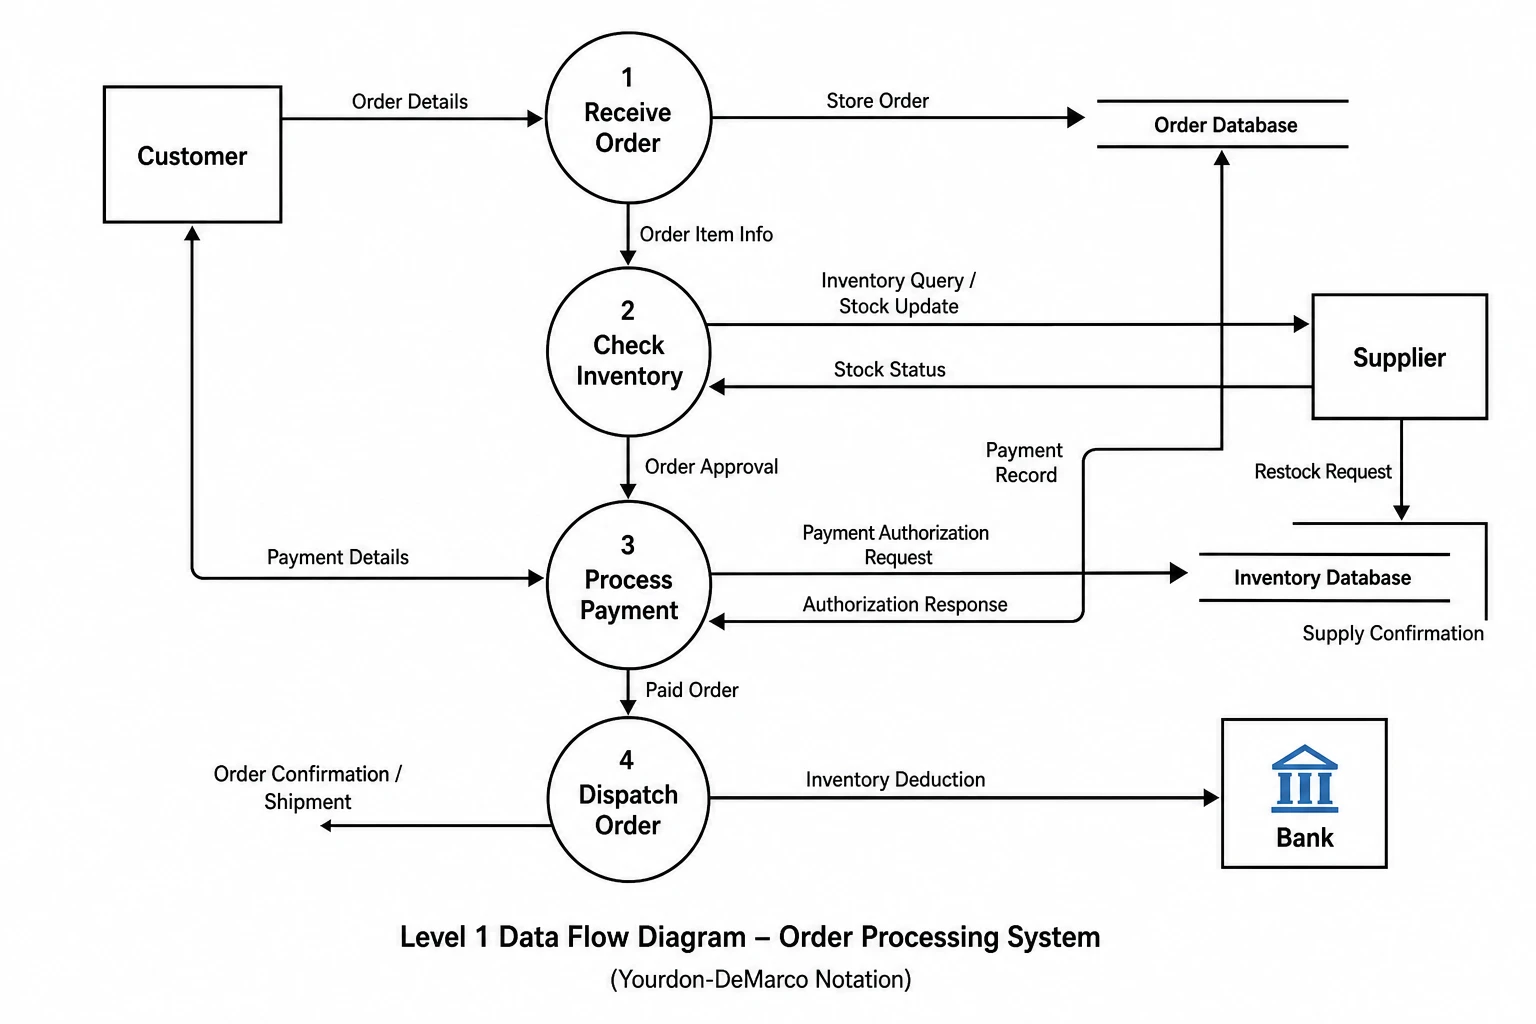
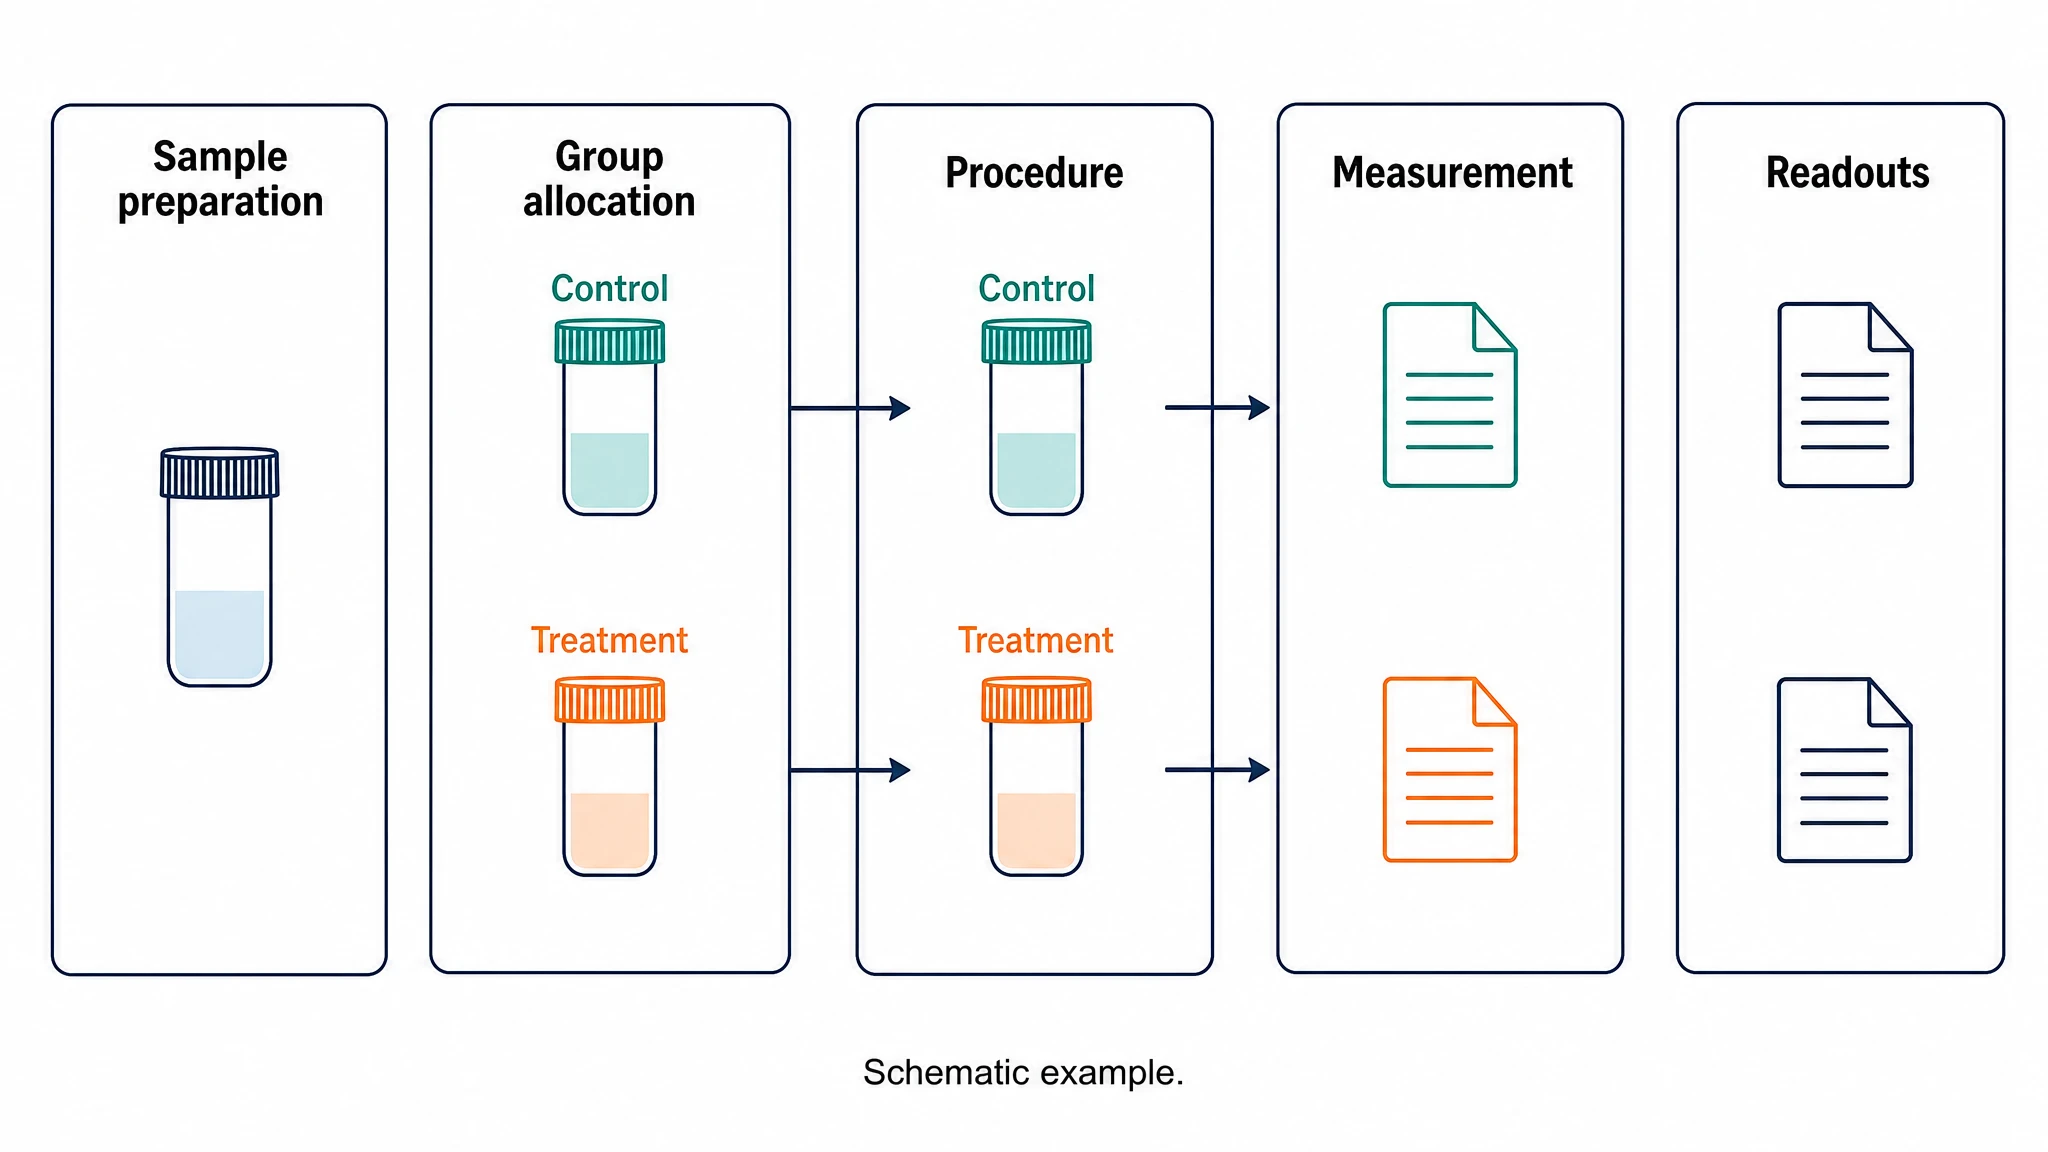
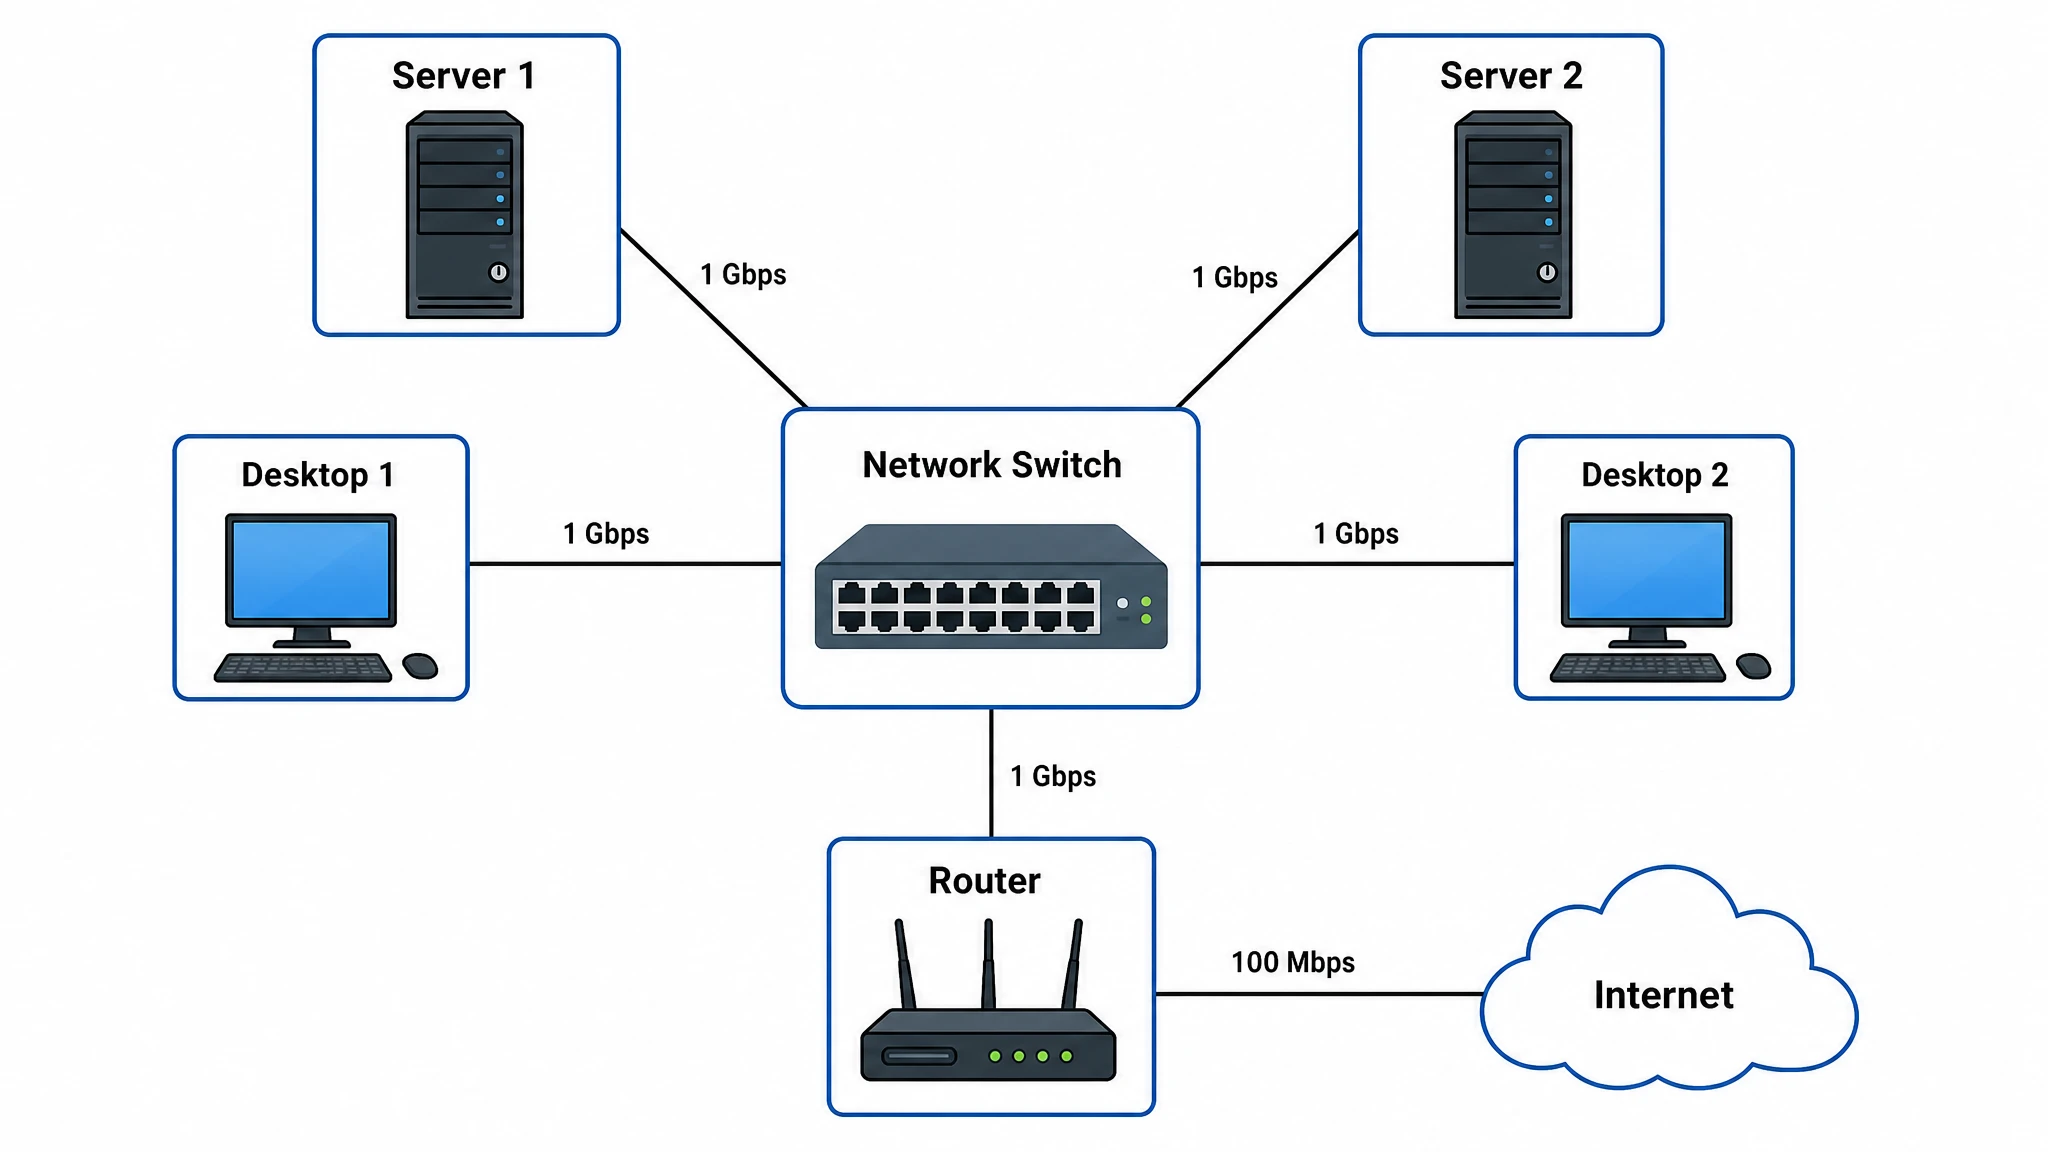
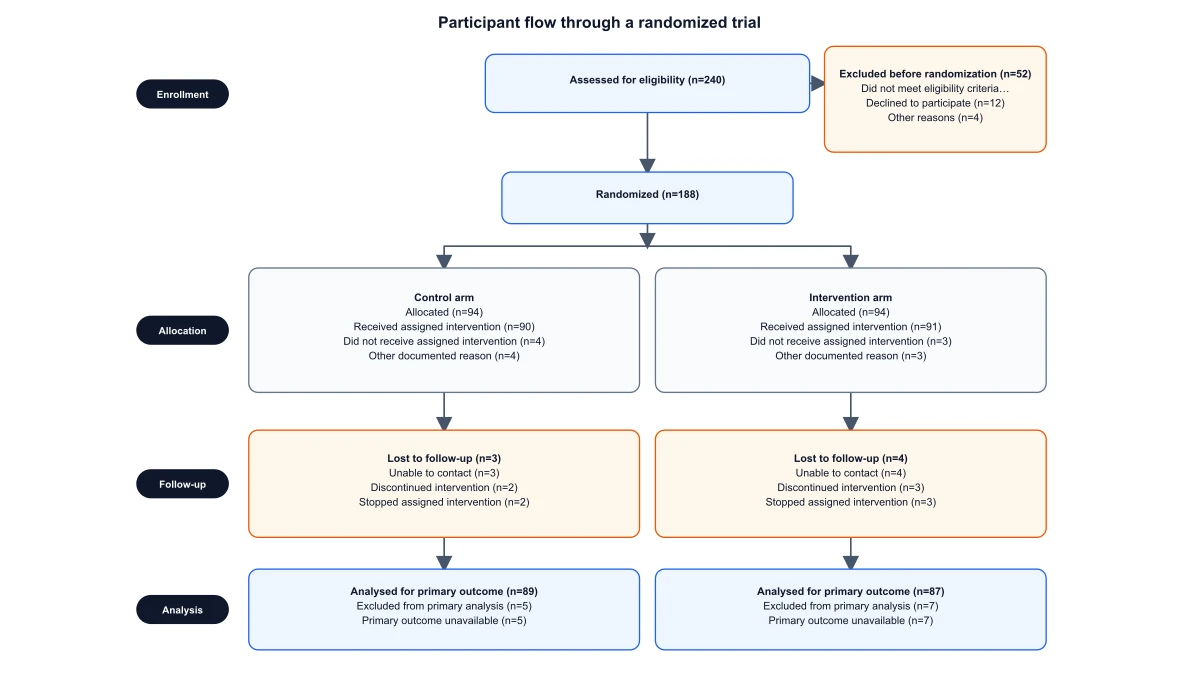
Figure 1 | Made with SciFig. a, Illustration — lipid nanoparticle targeted biodistribution. b, DataChart — volcano plot, HCC vs normal liver RNA-seq. c, FlowChart — PRISMA screening flow for a meta-analysis.
Trusted by 100K+ researchers from leading institutions:
One workspace · three engines
One AI scientific figure generator for illustrations, charts and flowcharts
From an idea, a data file or a protocol to a finished figure. Most papers need all three kinds of scientific figures — SciFig makes each of them and keeps every one editable.
Scientific images of mechanisms, pathways, graphical abstracts and cross-sections — from a sentence, a sketch, a photo or a PDF.
AI scientific illustration from text, sketches, photos, PDFs or references
Start from whatever you already have: a sentence, a napkin sketch, a lab photo, a paper or last year's figure. Watch each input become a ready-to-use scientific figure.
Input
Output
DataChart
Scientific graph maker for your data — 46 chart types researchers actually publish
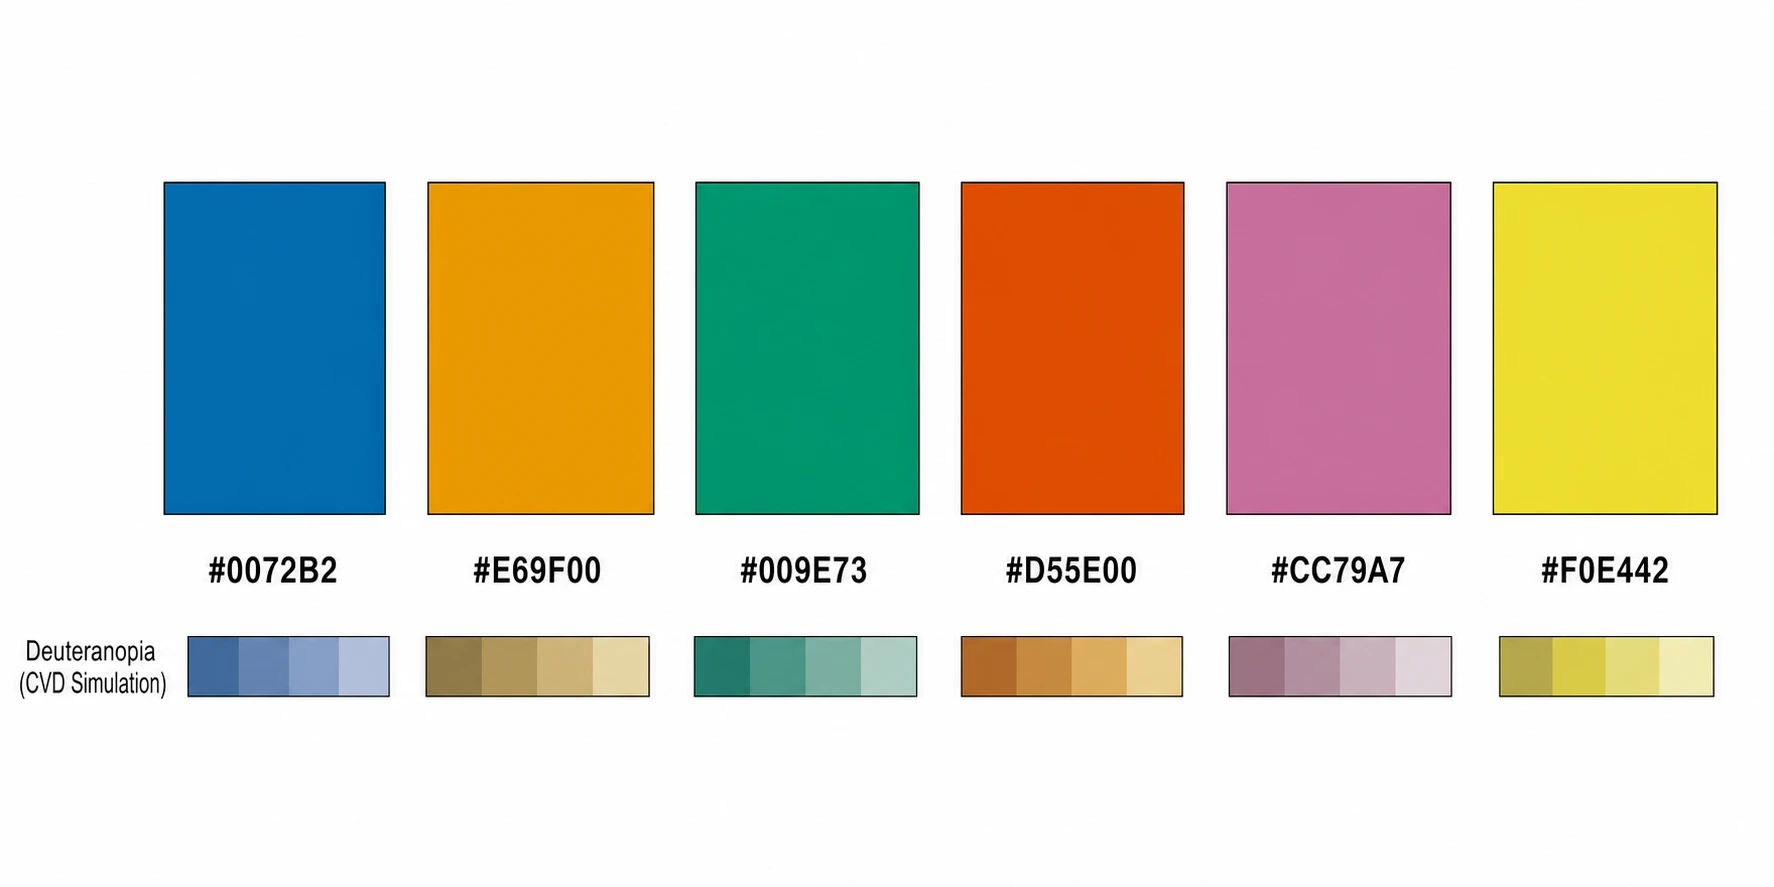
Charts and graphs drawn from your CSV or Excel file — in Nature, Science, Cell, PLOS or ACS style, with colorblind-safe palettes and Python code.
Basic & Trends
8
Distribution & Statistics
10
Relationships & Models
9
Biomedical
13
Flows & Structures
6
Volcano plotLiver cancer transcriptome
FlowChart
AI flowchart generator for research — write the protocol, get the diagram
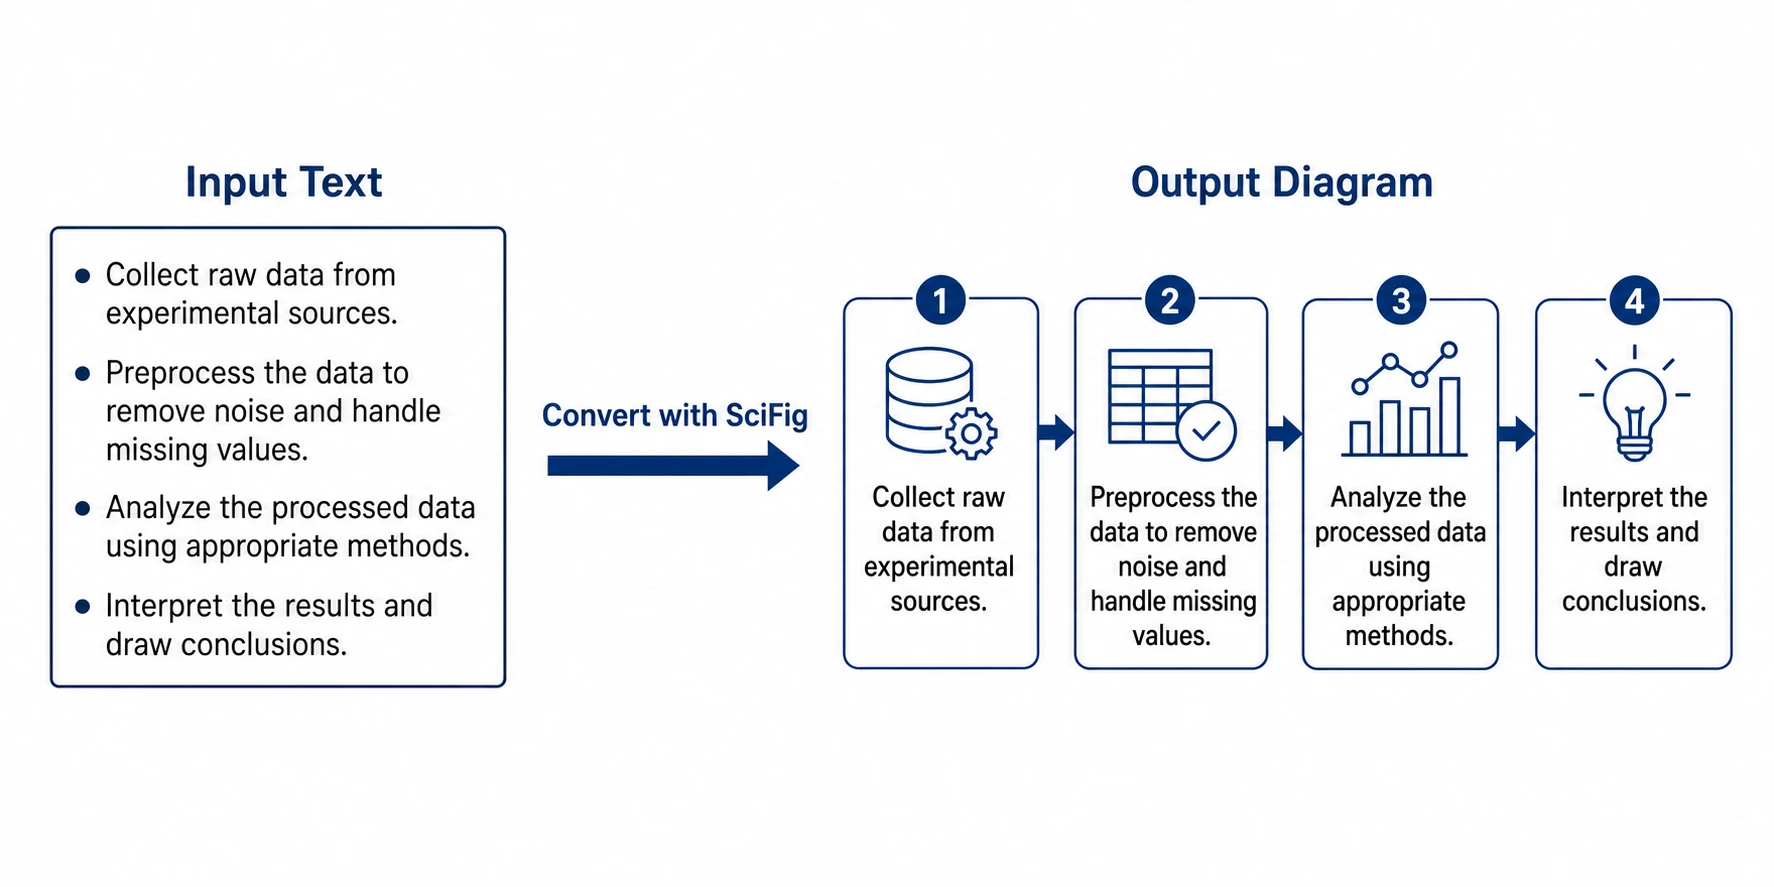
Describe the steps in plain language, from PRISMA and CONSORT flow diagrams to lab protocols. SciFig lays out the boxes, arrows and numbers — export SVG, PNG, JPG or editable PPTX.
Prompt
Molecular docking screen in three columns: preparation (PROPKA, pH 7.4), docking (Glide SP, 1.2 M compounds), rescoring (MM-GBSA).
Hybrid CNN–LSTM–attention network: CNN extractors feed two stacked LSTM layers; every hidden state merges in one attention layer.
Drug discovery cycle: target ID, hit finding, lead optimisation, preclinical, phase I, phase II/III, approval, monitoring.
Cell biology milestones, 2019–2023: gut organoids, spatial arrays, two-week live imaging, paired RNA + ATAC, a 180-type atlas.
Molecular docking screen in three columns: preparation (PROPKA, pH 7.4), docking (Glide SP, 1.2 M compounds), rescoring (MM-GBSA).
How it works
Three steps to an editable research figure
Start from text, a sketch, a paper or a data file; refine any label, chart or box in place; export a scientific figure that stays editable.
01
Start with any input
YOU
Type a description, drop a sketch, lab photo, PDF or reference figure — or upload a CSV or Excel file.
SCIFIG
Sends it to Illustration, DataChart or FlowChart and drafts a journal-grade figure in seconds.
YOU GET
A publication-ready first draft of an illustration, a chart or a flowchart.
02
Refine without starting over
YOU
Retype a label, redraw one region, switch the journal style or palette, or move a box and its arrows.
SCIFIG
Edits in place — the rest of the figure, and every value from your data, stays as it was.
YOU GET
The figure you meant, not a lookalike.
03
Deliver, still editable
YOU
Export editable PPTX, layered SVG or 8K PNG / JPG; DataChart charts also as PDF, EPS or TIFF.
SCIFIG
Keeps every shape and label editable, and ships each chart with its statistics and the Python code that drew it.
YOU GET
Journal-, poster- and talk-ready figures — no Illustrator round trip.
Edit everything
Every scientific figure stays editable — nothing is final until you say so
Change one label without regenerating the whole scientific figure. Every result stays editable, down to a single arrow.
PPTXSVGPNGPDF
01 / 08Region redrawCircle an area, describe the change.
Color palettes
Journal-ready color palettes for scientific figures
28 Illustration palettes, 9 DataChart palettes, 14 colormaps and 16 FlowChart themes — with journal-inspired styles and colorblind-safe options.
H&E InspiredIllustration · Curated
Curated
20
Journal-inspired
5
NPG ≈ Nature, AAAS ≈ Science; inspired by these journals' figures, not official colors.
Colorblind-safe
3
Templates
Start from 500+ templates for illustrations, charts and flowcharts
Open any scientific figure template with its prompt or sample data, then make it yours. Click any scientific image to see it at full size.
SciFig vs general AI image generators — accuracy you can check, output you can edit
A general image model hands you a flat picture. SciFig gives you scientific figures with structures you can check, data you can trace and output you can edit.
General AI image generatorsText-to-image models
SciFigAI scientific figure generator
Editable after generation
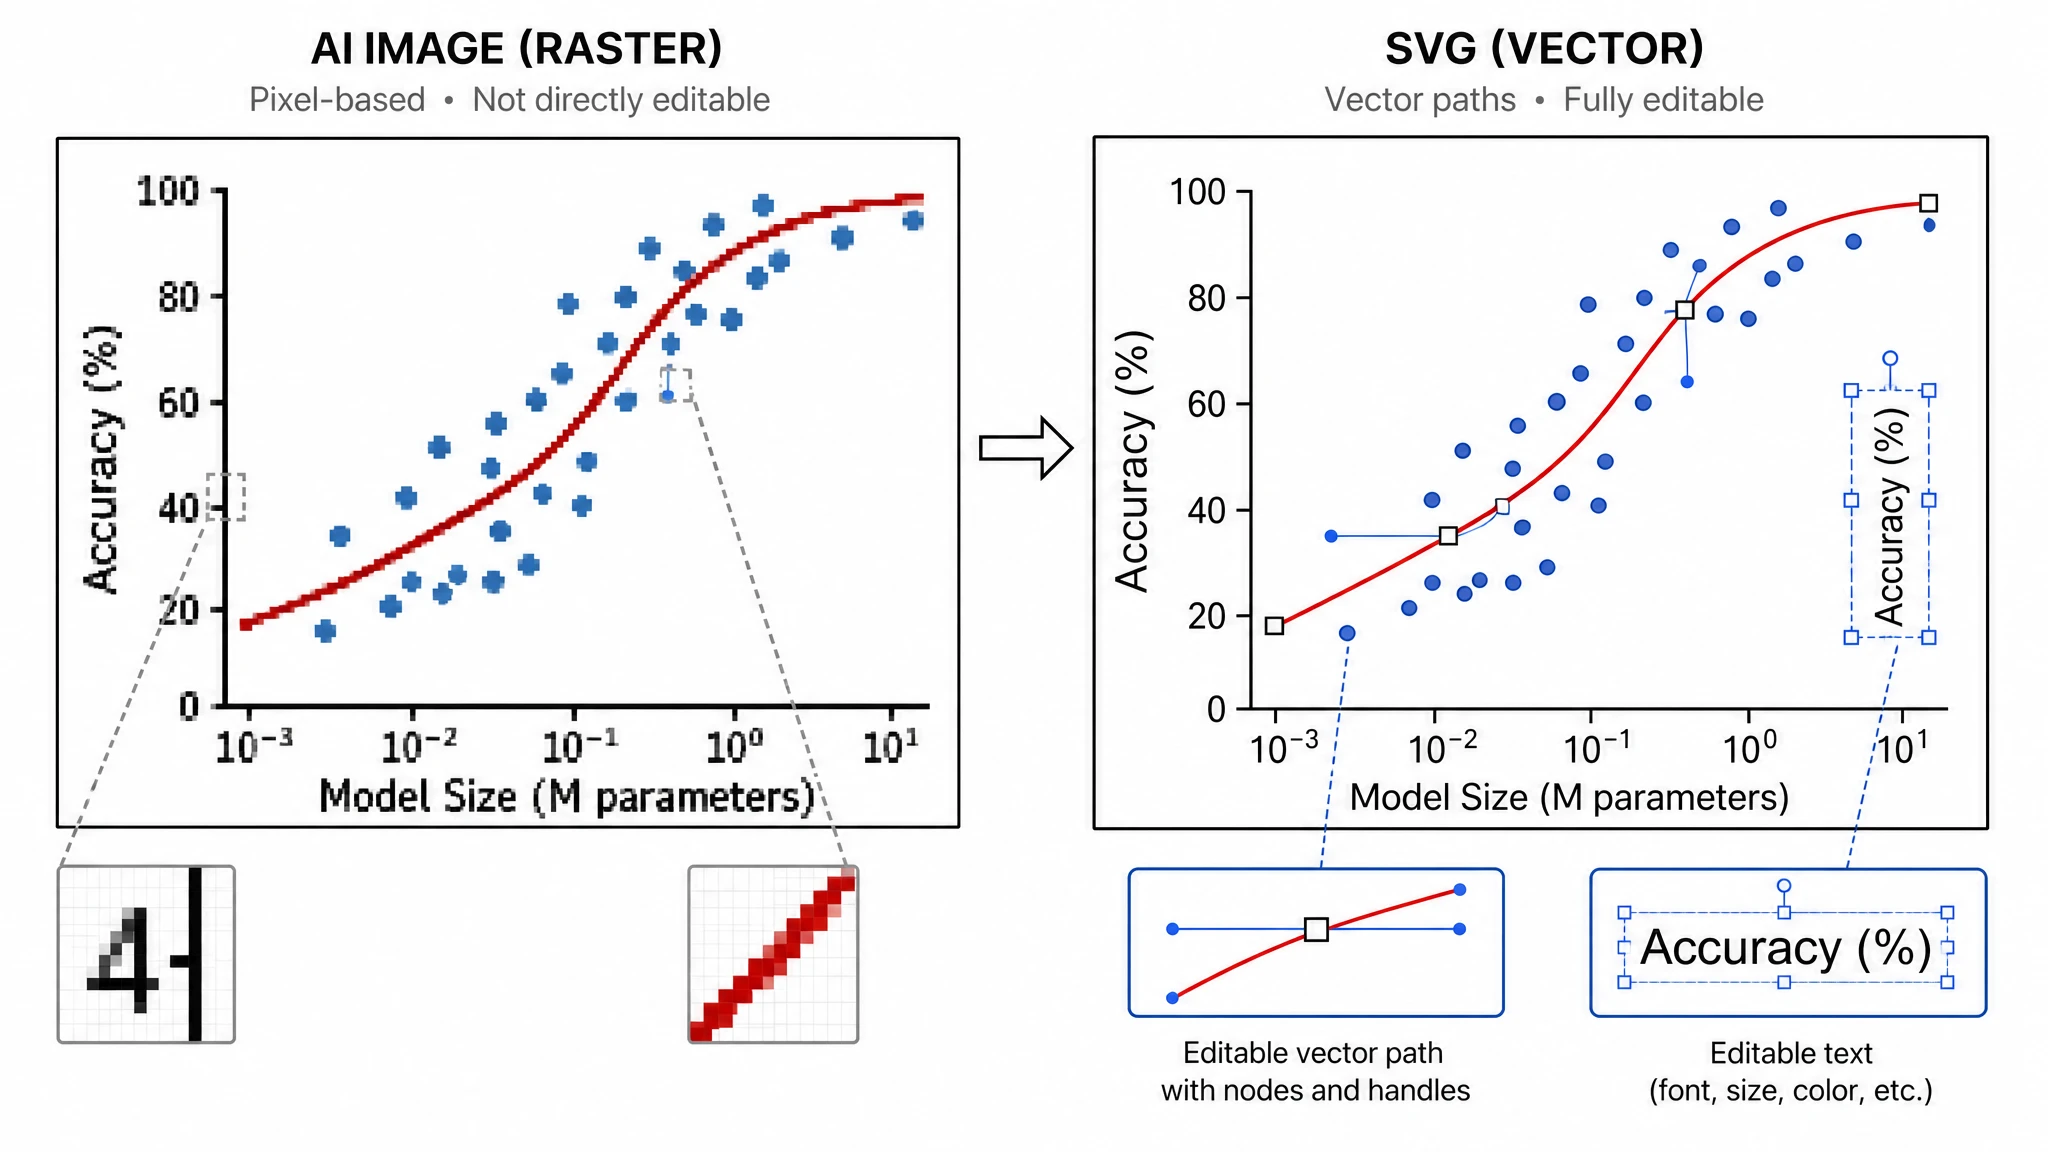
Flat raster only — regenerate the whole image to change one label
Vectorize once, then edit every shape and text object
Charts from your dataNew
A picture that looks like a chart; values are not tied to your data
DataChart plots your CSV or Excel file across 46 chart types
Flowcharts & diagramsNew
Box text often garbled; arrows cannot be moved
FlowChart draws PRISMA, CONSORT, model architectures and timelines as scientific diagrams with editable nodes
Scientific accuracy
Plausible-looking, often wrong structures and terminology
Built on discipline-specific terminology, and you correct anything the model gets wrong
Export formats
PNG / JPG
PNG, JPG, layered SVG and editable PPTX · DataChart charts also as PDF, EPS and TIFF
Publication licenseNew
Rights described only in the terms of service — nothing to show a journal for a specific figure
A PDF license certificate for each figure made or edited on SciFig, with a unique number and a public verification page (paid plans)
Resolution
Fixed output size
One-click Upscale to 4K / 8K PNG for large-format printing
Trusted by researchers
What our users actually say about the scientific figure maker
See how researchers use a scientific figure maker to create editable scientific figures, images, diagrams and charts for papers, presentations, and teaching.
10x
Faster scientific figure creation
3
Figure engines in one workspace
4+
Export formats
“I used to spend an entire day revising scientific figures for submission. With SciFig I describe the change in one sentence and get a publication-ready scientific figure in minutes.”
Dr. Wei L.
Postdoc, Molecular Biology, Stanford
“The editable PPT export is a game-changer. I can fine-tune labels and colors on a scientific diagram right in PowerPoint instead of going back to Illustrator every time a reviewer asks for changes.”
Prof. James R.
Associate Professor, Biomedical Engineering, MIT
“Our lab switched from BioRender last semester. The layered SVG output and built-in canvas give us far more control over every scientific illustration, and the AI actually understands scientific context.”
Maria S., PhD
PhD Candidate, Neuroscience, UCL
“I run a lab of 15 people. Before SciFig every student came to me for scientific figure help. Now they generate journal-quality scientific figures on their own — I just review and approve.”
Prof. Yuki T.
Principal Investigator, Systems Biology, ETH Zürich
“As a journal editor I see hundreds of scientific figures a month. Papers with SciFig scientific images consistently have cleaner layouts, correct labeling, and proper resolution. It shows.”
Dr. Elena V.
Associate Editor, Cell Reports Methods
“I teach undergraduate mechanics, and SciFig turned my free-body diagram prep from a two-hour chore into a ten-minute step. I just type what I need and get a clean, editable scientific diagram for every slide.”
Daniel M.
Lecturer, Mechanics, University of Toronto
“As a materials scientist I am constantly fighting journal requirements for vector formats. With SciFig I generate a polished scientific illustration and export straight to SVG as an editable vector — no more redrawing figures the night before submission.”
Dr. Anja K.
Materials Scientist, Max Planck Institute
“In our epidemiology group, building a PRISMA-style study flow diagram used to take half a day. Now I sketch the logic once, and SciFig gives us a clear scientific figure in minutes that everyone on the team can revise.”
Sofia L.
Research Coordinator, Epidemiology, Karolinska Institutet
“SciFig basically rescued my thesis slides. I describe a complex ecosystem concept, export the scientific image straight to PPTX, and drop it into my presentation instead of spending hours in PowerPoint.”
Mikkel H.
Master's Student, Environmental Science, University of Copenhagen
Free tools
A tool for every scientific figure
85 focused generators for the scientific figure you need — each opens in the right workspace with a matching example.
Everything you need to know about SciFig's scientific figure maker
Common questions about making scientific figures with SciFig — illustrations, charts, graphs and flowcharts.
1.
SciFig is a free online AI scientific figure generator and figure maker. Any input to a finished scientific figure in minutes.
Who it is for: Researchers, students, educators, R&D teams, and science communicators — anyone turning complex science into a clear figure.
Any input: A description, a PDF, a lab photo, or a reference image.
What it makes: Mechanism diagrams, pathways, workflows, medical illustrations, molecular structures — print-ready for journal submission.
Three engines: Illustration for mechanisms and graphical abstracts, DataChart for charts plotted from your own data, FlowChart for study flows and diagrams — first drafts in seconds.
2.
BioRender gives templates. Raw AI gives flat pixels. We give science-grade figures you can fully edit.
End-to-End, All-in-One: BioRender is a fixed template library — when your topic isn't in it, you're stuck. SciFig generates one-of-a-kind scientific figures from your text, PDF, photo, or sketch, then exports to PNG or JPG directly. Need vector layers for journal submission or element-level editing? Open the result in Vector Canvas and run Vectorize (paid plans and credit packs · 150 credits, charged once per figure) to unlock SVG for Illustrator, Inkscape, Figma, or Affinity, plus an editable-shape PPTX.
Editable, Not Locked Pixels: Nano banana and Midjourney bake a mislabeled protein into pixels you can't change — one wrong enzyme is a career-ending reviewer comment. SciFig lets you click any text label or shape in Vector Canvas and edit it directly; Vectorize converts the whole figure to a layered SVG when you need element-by-element control.
Charts From Your Real Data: DataChart plots the numbers in your uploaded file, so a chart never shows values you did not supply.
Free Trial, Low Entry Price: Try the core tools on free credits first — no credit card needed. When you upgrade, paid plans start at $100/year (about $8.33/month) or $29.9/month — whichever fits your research cadence.
3.
Yes. Upload a CSV, TSV, TXT or Excel file to DataChart and SciFig plots it as one of 46 chart and graph types built for publication.
From Your Numbers: Every value on the chart comes from your file — a volcano plot for RNA-seq or proteomics, a Kaplan–Meier survival curve for clinical data, plus forest plots, heatmaps, raincloud plots and ROC curves.
Journal-Ready Output: Pick a Nature, Science, Cell, PLOS or ACS style and a colorblind-safe palette, then export PNG, PDF, EPS or TIFF with the statistics and the Python code behind the chart.
4.
Yes. Describe the process in FlowChart — or paste your screening and enrolment counts — and SciFig lays out the boxes, numbers and arrows as an editable diagram.
Study Flows: A PRISMA flow diagram for systematic reviews and a CONSORT flow diagram for randomised trials, with every count in place.
Beyond Flowcharts: Model architectures, cycle diagrams and timelines, exported as SVG, PNG, JPG or editable PPTX.
5.
Yes. SciFig isn't a bio-only tool — 11 disciplines supported natively, with published examples you can browse and verify.
Far Beyond Biology: Biology, chemistry, physics, engineering, computer science, energy, ecology, bioengineering, astronomy, agriculture, materials — the major disciplines are all in. Mechanisms, workflows, cross-sections, ecosystems, graphical abstracts, journal covers, lab apparatus, microstructures, systems & networks — all nine high-frequency figure types covered.
No More "Bio-Only" Tools: BioRender locks its asset library to molecules and cells — try drawing a semiconductor band diagram, satellite orbit, or catalytic cycle and you're stuck if it's not in the template. SciFig generates straight from your description, PDF, or sketch — no fixed library required.
See for Yourself: Open Inspiration, filter by discipline, and every example ships with its original prompt — copy it into SciFig and reproduce it yourself.
6.
That's exactly who we built this for. SciFig is the AI scientific illustrator for the blank-canvas problem.
Describe It in Plain Language: Use Text-to-Figure. Type "CRISPR cutting DNA with PAM site" and SciFig proposes multiple layouts based on how peer-reviewed journals have visualized similar concepts.
Let a Paper Brief the AI: Use PDF-to-Figure. Upload the paper you're working from — SciFig's LLM reads it and generates a new scientific figure informed by the concepts inside. Stop staring at a blank canvas.
Start from Real Life: Use Photo-to-Figure or Sketch-to-Figure. Snap your lab rig or a whiteboard doodle — SciFig turns it into clean vectors. No design experience, no template library needed.
7.
AI gets you 99% there. You handle the final 1% — and that's the whole point.
Every Element is Editable: Labels, arrows, molecules, organs, legends — each a separate object. Click to fix a mislabeled protein, swap a wrong enzyme, or re-route an arrow — one click, done.
99% = 0% in Science: Raster AI tools (Midjourney, nano banana) bake mistakes into pixels you can't edit. SciFig keeps every element editable because you — the expert — are the final authority.
Charts and Flowcharts: DataChart takes every value from your uploaded file, and FlowChart takes its counts from your own description — the model does not invent the numbers.
8.
Yes. You own every scientific figure you make — for journals, for products, for anything legal.
Full Publication Rights: Paid plans come with full authority to publish in peer-reviewed journals, on preprint servers, and in your thesis. No tier-gating on publication.
Full Commercial Rights: Use your figures in textbooks, commercial products, courses, consulting decks — no additional licensing fees, no revenue share, no "just for research" fine print.
Zero Ownership Claim: SciFig claims no ownership, no usage license, no right to feature your work. (Note: Free plans are for non-commercial evaluation only — upgrade before publication or commercial use.)
9.
It's your call — and your target journal's policy. No universal rule yet.
Check Your Target Journal First: AI-disclosure policies change fast and vary by publisher. Spend 30 seconds on your journal's author guidelines before submission — it's almost always answered there.
When in Doubt, a Methods Line Covers You: If the policy is ambiguous, a one-line "Figures prepared with SciFig (AI-assisted)" in the methods section is the safe middle ground — no over-explaining, no hiding.
10.
Every format journals, posters, and slides actually need.
Direct Generation Exports: PNG (recommended for journal submission) and JPG (smaller files for sharing or email). Every generation tool exports these two.
Vector Canvas Adds Layered Output: Open any generated figure in Vector Canvas and run Vectorize (paid plans and credit packs · 150 credits, charged once per figure) to unlock SVG (opens in Illustrator, Inkscape, Figma, or Affinity Designer) plus an editable-shape PPTX where every element is a separately selectable PowerPoint object.
Resolution: PNG and JPG at generation resolution, or one-click Upscale to 4K / 8K PNG for large-format printing and journal cover art.
DataChart: Charts also export as PDF, EPS and TIFF.
FlowChart: Flowcharts export as SVG, PNG, JPG and editable PPTX.
11.
Yes, absolutely. Every scientific image exported at 1K or 2K hits 300 DPI at standard journal column widths.
Single-Column Figures: 1K resolution hits 300+ DPI at standard single-column width — cleared for submission out of the box.
Double-Column Figures: 2K resolution hits 300+ DPI at full-page width. No reviewer "please improve figure resolution" comments.
Posters & Covers: Need bigger? One-click Upscale to 4K/8K for A0 posters and journal cover art — detail stays sharp, no pixelation.
12.
Yes. Invoice-ready, grant-line-item-ready, zero finance friction.
Formal Invoices: We issue tax-compliant invoices with your institution's address, tax ID, and itemized usage — drop them straight into your reimbursement system.
Grant Line Item: SciFig bills cleanly as "scientific visualization software" — the same category your lab probably already covers for GraphPad, Prism, or Illustrator.
Three Subscription Shapes: Individual top-up credits (pay as you go), monthly subscriptions (for regular figure makers), and team / institution plans with bulk credits and single-invoice billing. Contact us for a lab or department quote.
13.
Yes. Your unpublished research stays yours, full stop.
Zero AI Training: We NEVER use your private uploads, prompts, or generated figures to train our models — ever.
Encrypted End-to-End: All files are encrypted in transit and at rest. Nobody else can see your work — including the data files you upload to DataChart.
14.
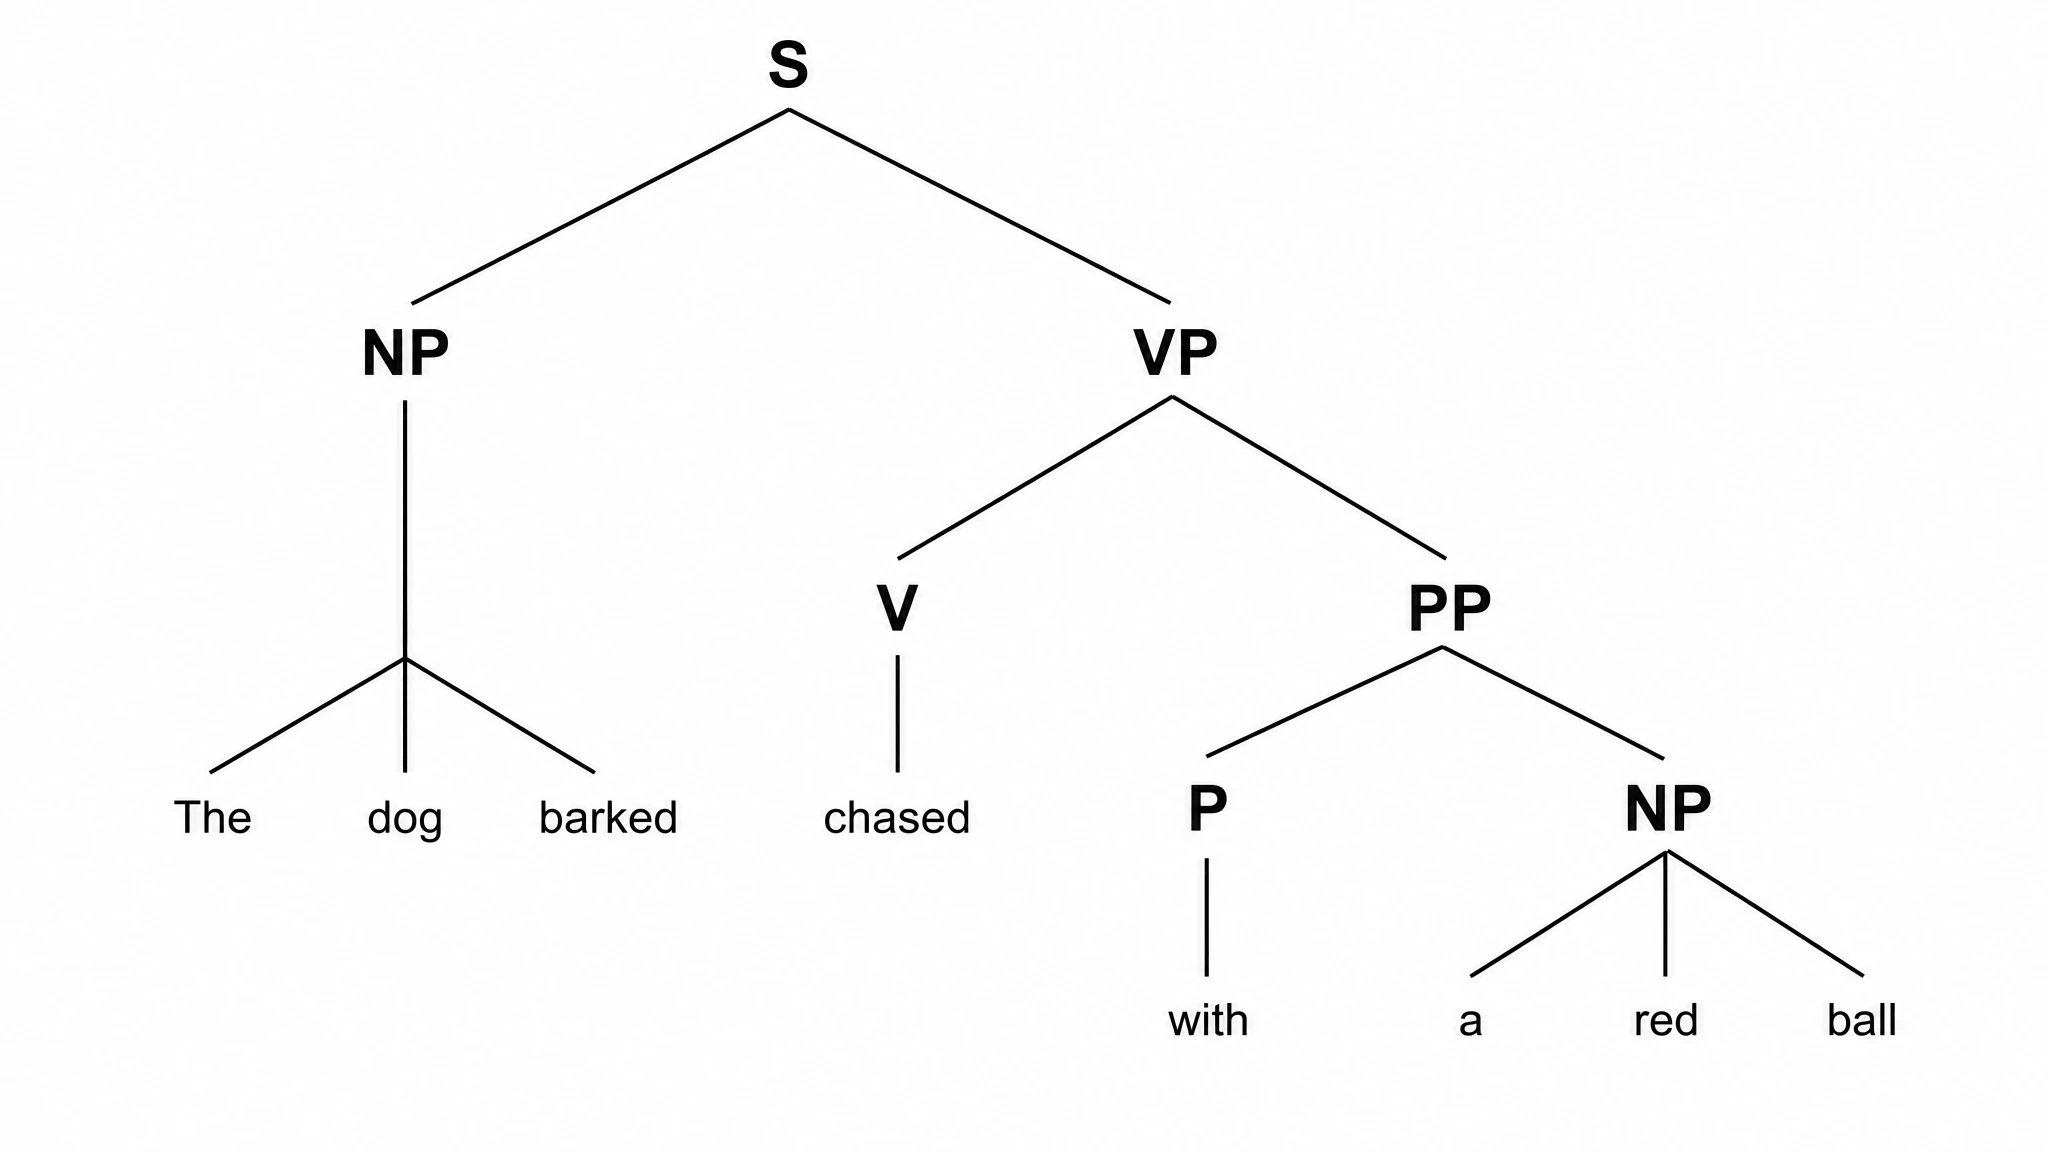
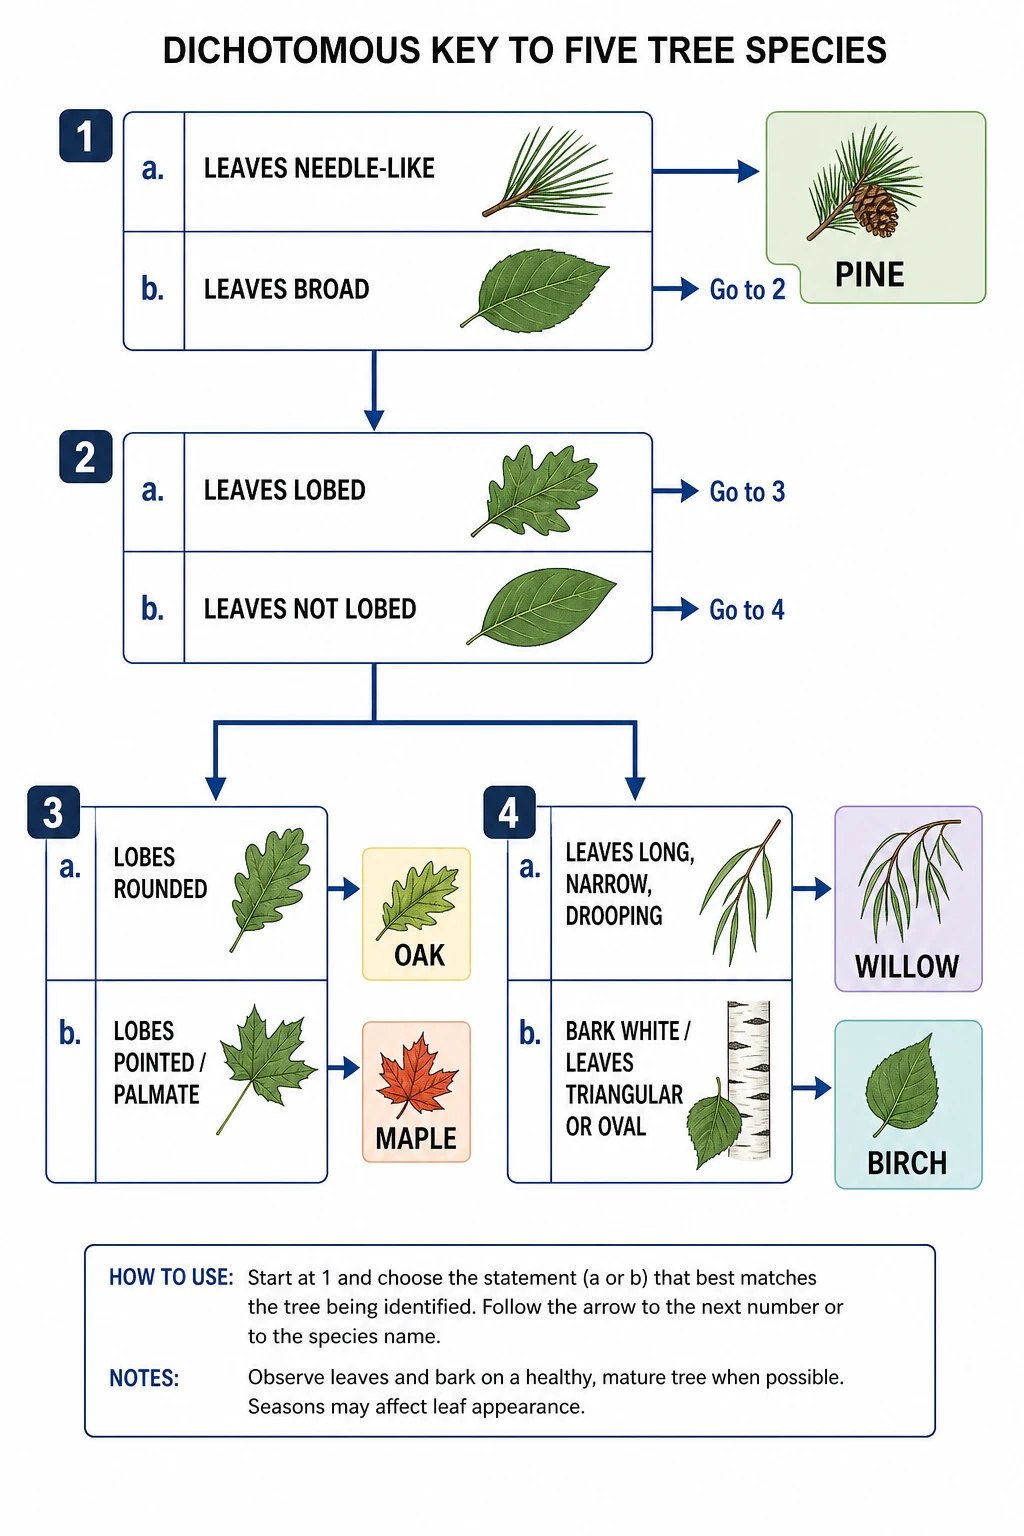
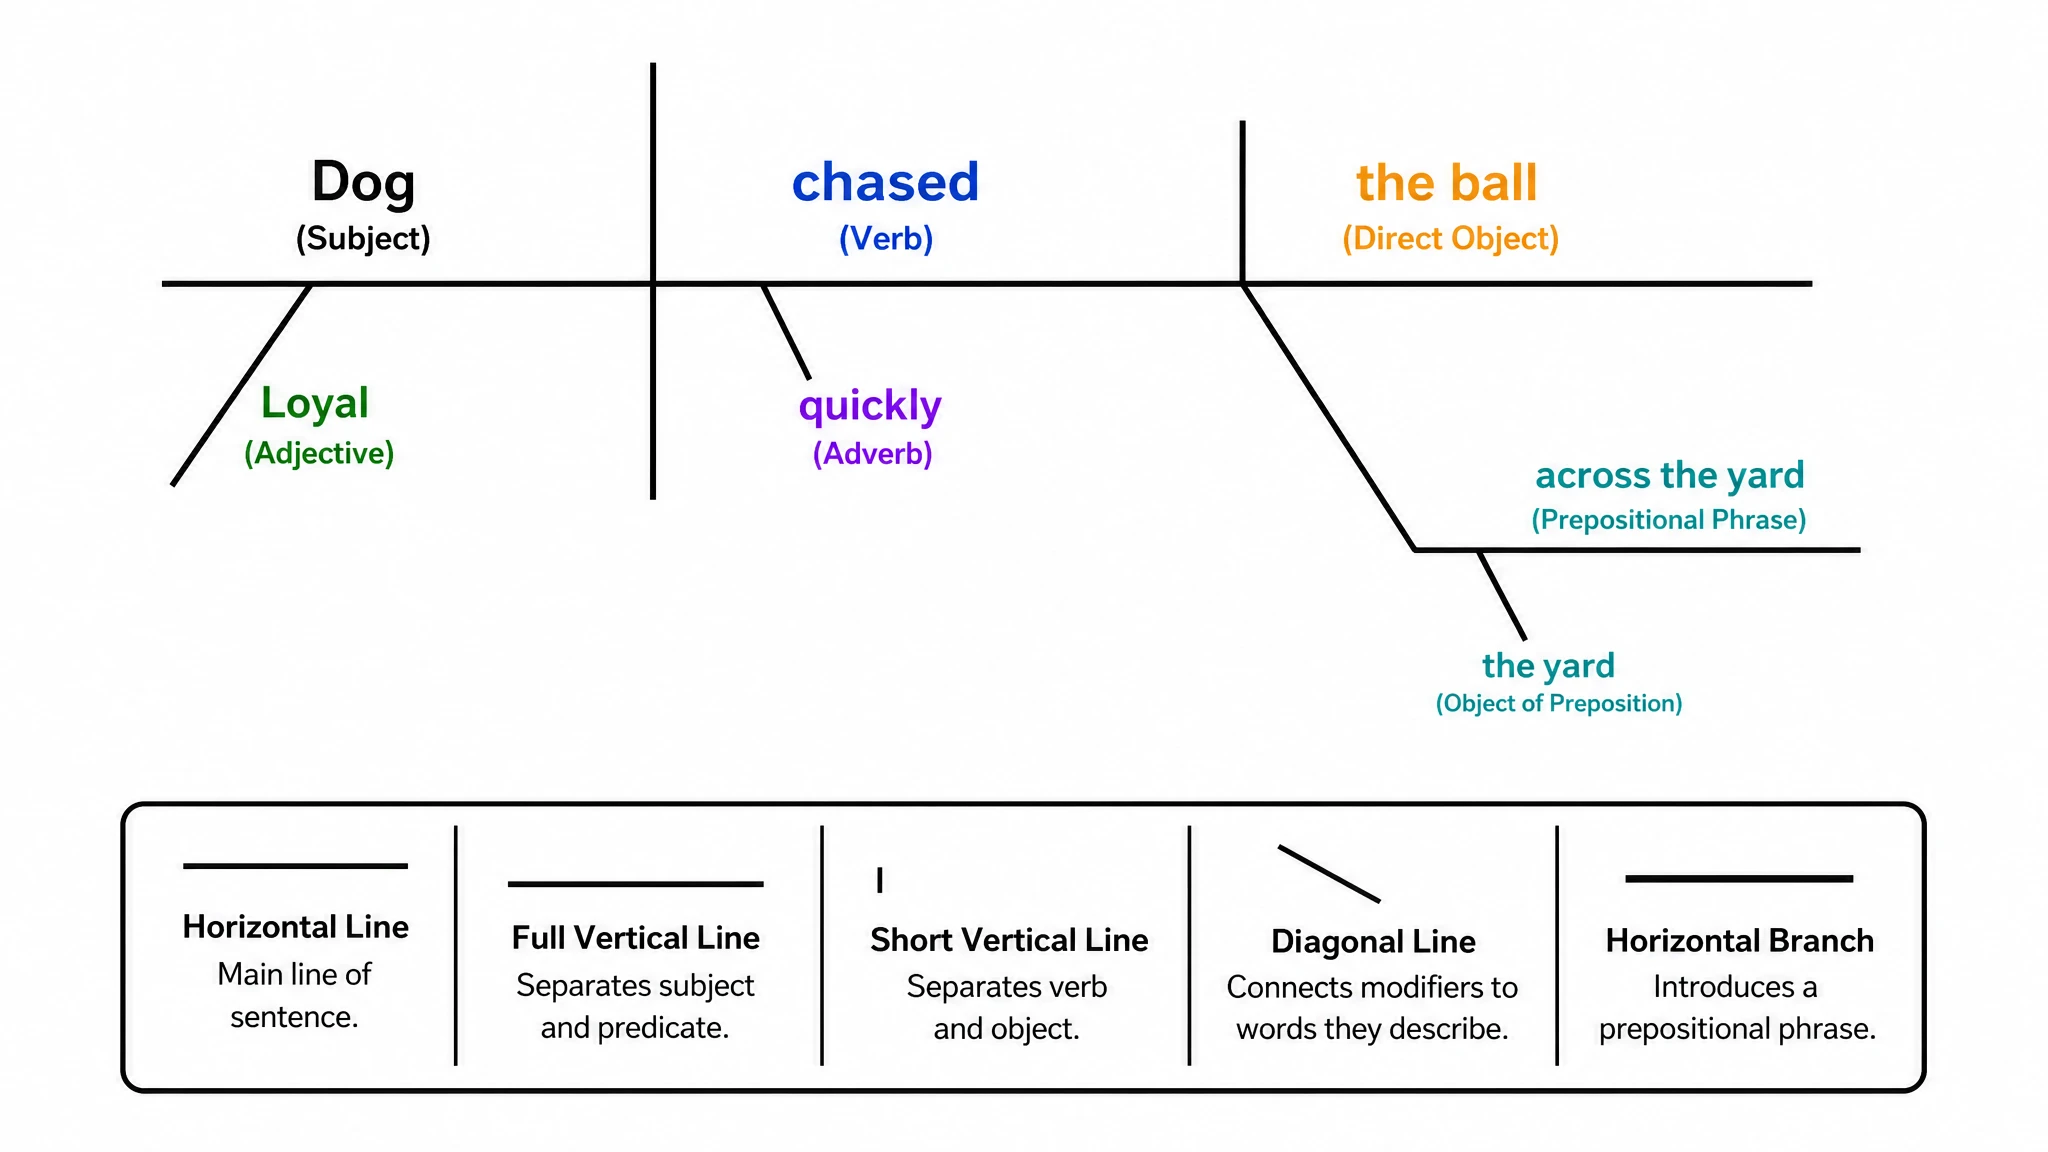
A scientific diagram simplifies a structure, process, or relationship. Use FlowChart for editable SVG flow and structure diagrams, Illustration for mechanism and conceptual artwork that can be converted to SVG, and DataChart for numerical charts from table data.
15.
In science, a figure is a visual that presents evidence or explains an idea: a chart, a micrograph, a mechanism diagram, or a composite panel. SciFig helps draft conceptual illustrations, plot charts from tables in DataChart, and create editable process diagrams in FlowChart.
16.
Scientific illustration is drawing made to communicate science accurately rather than decoratively — anatomy, specimens, mechanisms, instruments. It prioritises correctness and legibility over realism. SciFig drafts one from your description, and you correct the details only you would catch.
17.
To make scientific figures for a research paper, use Illustration for mechanisms and graphical abstracts, DataChart for charts and graphs from your data, and FlowChart for study designs, methods and flow diagrams. Describe the figure in plain language, or upload the paper itself. This scientific figure generator drafts a first version, then you fix labels and layout on the canvas. Export the scientific image as PNG or JPG for submission, or run Vectorize (paid plans and credit packs · 150 credits, charged once per figure) for layered SVG and editable-shape PPTX.
18.
One message per panel. Real text labels, not baked-in pixels. A colorblind-safe palette that still reads in grayscale. And an editable source file — because the figure you can revise in ten minutes is the one that survives review. A scientific figure maker with layered output does the last part for you.