
Bode Plot Generator
Generate accurate Bode plots showing magnitude and phase frequency response from any transfer function — for control systems research and engineering papers.
Figure prompt
Describe the figure you want to create
Subject / Details (e.g., a process flow, key labels, visual style)
Not sure where to start? Use Example.
Start with 100 free credits|No credit card required
Get up to 300 free credits on day one when you join through an invite.
Reviewed by SciFig TeamUpdated
Bode Plot Generator— templates & examples
Everything you need to generate your Bode plot
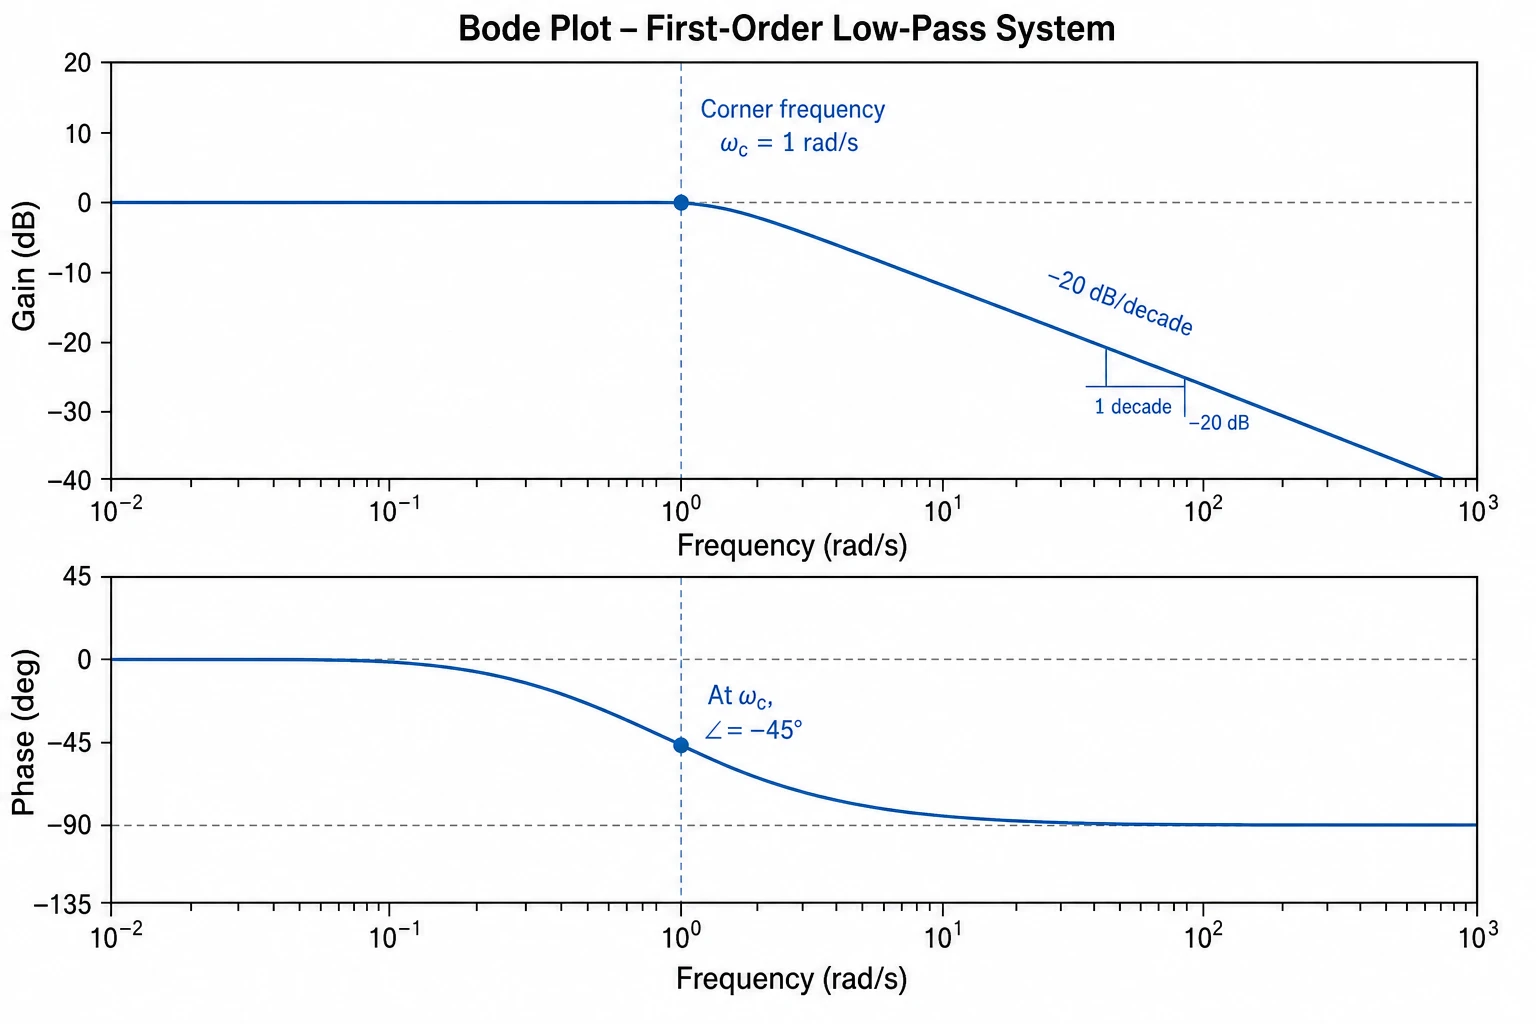
Plot magnitude and phase from a transfer function
Enter your transfer function description — poles, zeros, gain, and time constants — and SciFig's Bode plot generator computes the magnitude and phase frequency response and draws both logarithmic curves. Corner frequencies, resonant peaks, and roll-off slopes are rendered accurately so your Bode plot reflects the true behavior of your system without manual curve-sketching.
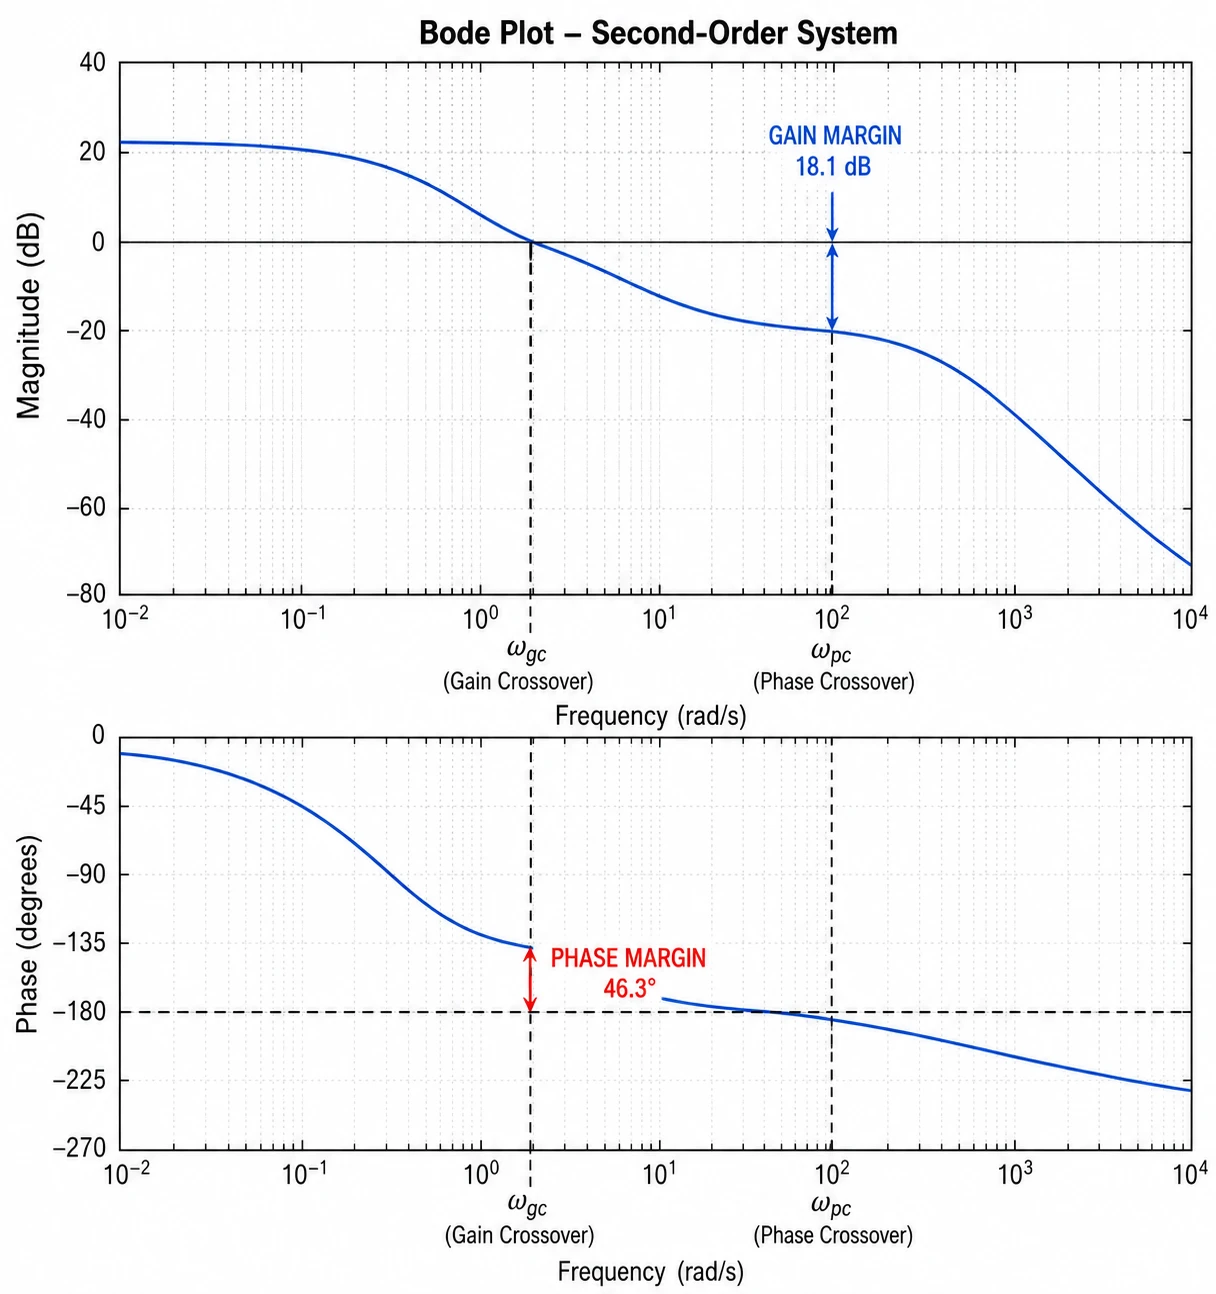
Label gain and phase margins automatically
SciFig's online Bode plot generator marks the gain crossover frequency, gain margin, and phase margin directly on the diagram. The Bode plot calculator annotations follow the conventions expected in control-systems textbooks and journal papers — dashed vertical reference lines, labeled dB and degree values — so stability analysis results are immediately legible to reviewers.
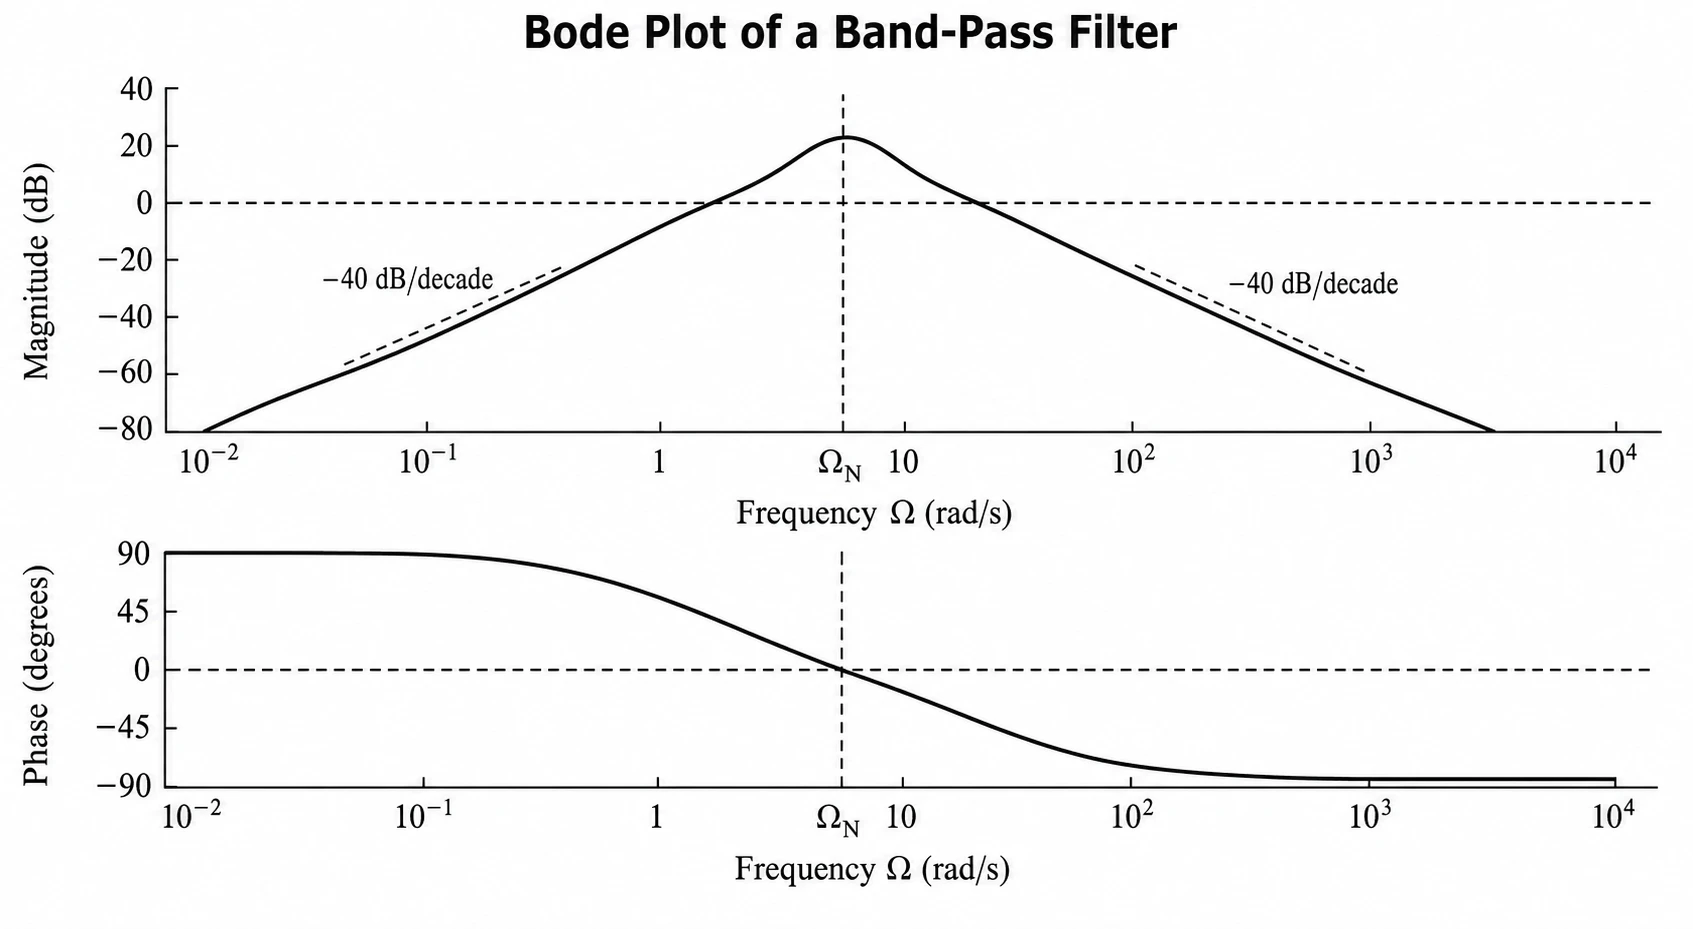
Export a publication-ready Bode plot
Download your Bode plot as a high-resolution figure sized for any journal or thesis format. SciFig's Bode plot generator keeps the magnitude and phase plots fully editable — adjust axis ranges, add labels, annotate corner frequencies, and re-export at any time. Use it as a reusable frequency-response tool throughout your research project.
What is a Bode plot?
A Bode plot is a pair of graphs showing how a system's gain and phase shift vary with frequency. The magnitude plot shows gain in decibels on a log axis; the phase plot shows phase angle in degrees. Together they reveal stability margins and bandwidth. Bode plots are standard in control systems, signal processing, and electrical engineering. With SciFig's Bode plot generator you describe a transfer function and generate a clean, labeled magnitude and phase diagram ready to export for your paper.
Why you need a Bode plot
- Reveals gain and phase margins that determine whether a feedback system is stable
- Required for most control-systems, signal-processing, and electronics course reports
- Logarithmic frequency axis compresses wide frequency ranges into a readable diagram
- Corner frequencies and roll-off slopes identify dominant poles and zeros at a glance
- Gain plot and phase plot together give a complete frequency-response picture
- Standard format accepted by control-systems, IEEE, and engineering journals
Key components of a Bode plot
- Magnitude plot — gain in decibels versus log frequency on the upper graph
- Phase plot — phase angle in degrees versus log frequency on the lower graph
- Corner frequencies — points where slope changes due to poles or zeros
- Gain crossover frequency — frequency where magnitude equals 0 dB
- Phase margin — phase above –180 degrees at the gain crossover frequency
- Gain margin — additional gain before instability at the phase crossover frequency
Where Bode plots are used
- Control systems design and stability analysis in engineering research
- Electronic filter design for amplifiers, equalizers, and audio systems
- Signal processing papers analyzing frequency-domain system behavior
- Mechanical engineering vibration and dynamic response studies
- Power electronics and converter control research
- Robotics and servo system frequency response characterization
How to make a Bode plot
Describe your Bode plot
Tell SciFig what to draw in plain language — no design tools required.
Generate with SciFig
Get a clean, publication-ready figure that matches your description in seconds.
Edit & export
Vectorize it into editable SVG, relabel everything, and export for your paper, poster, or slides.
Bode Plot Generator — Frequently Asked Questions
Common questions about Bode Plot Generator.
More tools

Circuit Diagram Maker
Generate accurate circuit diagrams with labeled schematic symbols for research papers, lab reports, and technical publications.

Free Body Diagram Generator
Create accurate, publication-ready free body diagrams with labeled force vectors for weight, normal force, friction, and tension in seconds.

Graphical Abstract Maker
Generate a publication-ready graphical abstract — a single-panel visual summary that captures your study's methods, key finding, and result with clear icons and flow arrows.
Home
Free AI Scientific Figure Generator and Figure Maker — Create Research Figures, Images, Illustrations and Diagrams
Text-to-Figure
Generate a figure from a plain-language description
Models
Default to GPT Image 2 for journal papers; switch to Nano Banana Pro for slides and posters; pick Nano Banana 2 for routine figure work
Tutorials
Seven short walkthroughs of the AI scientific figure generator
Blog
Tutorials, tool comparisons, and publication tips for researchers.
Inspiration
Explore publication-ready scientific figure examples, copy the prompts, and use them as starting points for your own work.

Ready to publish?
Make your own Bode plot in minutes.
Start for freeFree to start · No credit card required · Built for researchers